Contents
Over the course of the 1990s, enormous strides were made in increasing work among groups that had traditionally low labor force participation, such as single mothers and welfare recipients. Many of these workers have joined the low-wage labor market, and some continue to rely on government benefits, such as food stamps, to make ends meet. These workers compete for jobs in the low-wage labor market with other groups of low-wage workersfrom those seeking their first job out of high-school to middle-aged and older workers trying to support their families. For all these low-wage workers, particularly those in low-income families, it is of great interest to policymakers to better understand the factors that help low-wage workers attain higher wages and become independent from public assistance programs or self-sufficient. These factors include personal and family characteristics of low-wage workers as well as public programs that support work, such as child care and transportation assistance.
This study documents and analyzes the dynamics of the low-wage labor market and the role of work supports in helping low-wage workers in the early 2000s. We address these issues in four areas:
- a profile of low-wage workers demographic and job characteristics;
- low-wage workers wage progression;
- low-wage workers progress toward self-sufficiency; and
- the role of work supports in low-wage workers progress toward self-sufficiency.
Below we provide a discussion of our analytic approach, followed by a summary of our key findings in each area.
[ Go to Contents ]
Analytic Approach
The primary dataset used for this study is the 2001 panel of the Survey of Income and Program Participation (SIPP), a nationally representative sample of the noninstitutionalized population. The 2001 SIPP is a 36-month panel, with respondents interviewed every four months about the previous four months. The SIPP has a host of demographic and family characteristics and collects detailed information on income, employment and wages, job characteristics, and receipt of government benefits and work supports. We supplement these data with state-level economic data from the U.S. Census Bureau and the U.S. Department of Labor, as well as information on social support program rules and spending from multiple sources.
For this study, we define a low-wage worker as any individual age 16 to 64 who works for pay, is not a student, and whose hourly wage is less than what is required for a full-time, full-year worker (i.e., 2,080 hours) to earn enough to keep a family of four out of poverty. Under this definition, a worker in 2001 (the first year of the 2001 SIPP) is considered a low-wage worker if his or her hourly wage rate is below $8.63. This is equivalent to $10.50 in 2008.
The first part of our study provides a descriptive analysis of the individual, family, and job characteristics of low-wage workers in January 2001. We also make comparisons to the characteristics of low-wage workers in January 2003. In addition to the full low-wage worker population, we include profiles of several key subgroups of low-wage workers that are of particular policy interest: unmarried mothers (living with their children under age 18), less-educated (high school degree or less) black men, and low-wage workers in low-income families (defined as less than 200 percent of the poverty threshold).[1]
The second part of our study analyzes whether low-wage workers experience wage progression over time and the factors that influence wage progression. We include two measures of wage progression. First, we examine the percentage of workers in low-wage jobs in January 2001 who have transitioned to moderate- or higher-wage jobs or remain in low-wage jobs in January 2003. We define moderate wages as between one and two times the low-wage threshold and high wages as at least two times the low-wage threshold. Second, we analyze the percentage increase in the wage rates of low-wage workers between January 2001 and January 2003. For each measure, we use multivariate analyses to examine the relationship of low-wage workers wage progression and their individual, family, and job characteristics. We also include separate descriptive analyses for the key subgroups mentioned above.
The third part of our study examines low-wage workers progress toward self-sufficiency and the characteristics associated with higher levels of self-sufficiency. This component of the analysis focuses on low-wage workers who live in low-income families. This subpopulation is of particular interest because increases in these workers wages can have a relatively large impact on family well-being and because these families are most likely eligible for government supports. We first examine the composition of low-wage workers family incomes, assessing the relative roles of earnings and government benefits. We then report on a specific measure of self-sufficiencythe self-sufficiency indexwhich is defined as the ratio of family earned income to family needs, where needs are measured by the federal poverty threshold. Low-wage workers in families with a higher self-sufficiency index are more self-sufficient in that their earned income covers a greater share of their needs. This measure captures how well-off low-wage workers families are in the absence of any government support. Using multivariate analyses, we analyze the relationship between the level of self-sufficiency and individual and family characteristics. This part of the study also includes separate analyses for the subgroup of low-wage unmarried mothers in low-income families.
The final part of our study analyzes the role of work supports in helping low-wage workers achieve self-sufficiency. We examine three government-provided work supports: child care subsidies, transportation subsidies, and the earned income tax credit (EITC). Child care and transportation subsidies are categorized as work supports, as these benefits are targeted directly at low-wage workers specific employment-related needs. The EITC more generally supplements low-wage workers earnings, but it is considered a work support because the benefits are directly linked to workers earnings and individuals without earnings cannot receive the credit. We estimate the relationship between the level of self-sufficiency (the earnings-to-needs ratio) and receipt of work supports. This estimation is complicated by the fact that persons who do and do not receive work supports can differ in systematic ways that make simple comparisons unreliable. We conduct two types of multivariate analysis modeling approaches designed to provide more reliable estimates.[2] Although these analyses have limitations, they help us better understand the role work supports play in helping families move toward self-sufficiency.
[ Go to Contents ]
Key Findings
This study provides a portrait of low-wage workers, their wage growth, progress toward self-sufficiency, and the role of work supports in this progress. We summarize our key findings in each area here.
Profile of Low-Wage Workers
What share of workers is low-wage?
- More than a quarter of all workers in 200126.9 percent or over 28 million peoplewere low-wage workers, earning less than $8.63 an hour.
- The percentage of workers that are low wage is fairly steady over time. Our most recent data shows that 24.4 percent of workers were low wage in 2003. A prior study using the same definition found that 28 percent of workers in 1996 and 25 percent in 1999 were low wage (Schochet and Rangarajan 2004).
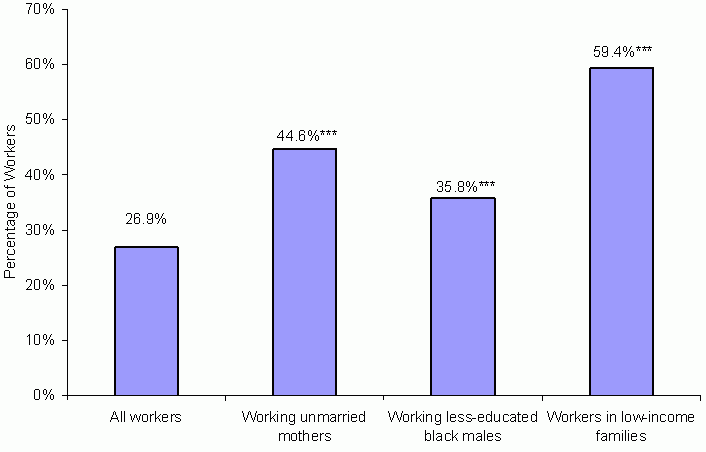
- Key subgroups of the population are disproportionately likely to be low-wage workers (exhibit ES-1). In 2001, 44.6 percent of all working unmarried mothers were low wage and 35.8 percent of working less-educated African American men were low wage. More than half of workers in low-income families, 59.4 percent, were low wage in 2001.
Exhibit ES-1:
Percentage of Workers in Low-Wage Employment in January 2001, by Population Subgroup
Source: Authors tabulations of the 2001 SIPP panel.
Note: *** indicates a statistically significant difference (at the p 0.01 level)
between the low-wage worker subgroup and all other low-wage workers.
What are the characteristics of low-wage workers?
- Low-wage workers differ from higher-wage workers (i.e., all workers who are not low wage) in important ways. They are disproportionately female, young, black, Hispanic, and unmarried. They are more likely to have a health-related work limitation and less likely to live in a metropolitan area.
- Low-wage workers have substantially less education than higher-wage workers. Twenty percent of low-wage workers have less than a high school degree, compared with only 6.2 percent of higher-wage workers. And only 11.0 percent of low-wage workers have a college degree or more, compared with 32.5 percent of all higher-wage workers.
- Low-wage workers live in different family structures than higher-wage workers, although family size and number and age of children are similar to higher-wage families. Low-wage workers are more likely to be single with children or cohabiting with children and are less likely to be married.
- Low-wage workers are as likely as higher-wage workers to have another employed adult in their family. Despite differences in marital status, roughly 55 percent of low-wage and higher-wage workers live in families where another adult is employed.
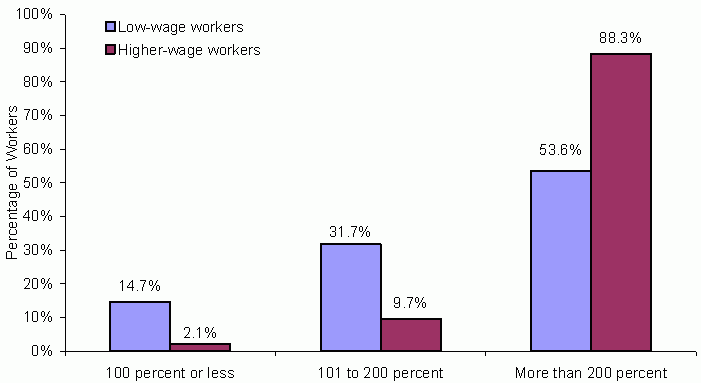
- Low-wage workers are disproportionately poor and living in public or subsidized housing compared with higher-wage workers. About 14.7 percent of low-wage workers live in families with income below the poverty threshold, compared with only 2.1 percent of higher-wage workers (exhibit ES-2).
Exhibit ES-2:
Income as a Percentage of the Poverty Threshold for Workers in January 2001
Source: Authors tabulations of the 2001 SIPP panel.
Note: The difference between low-wage workers and higher-wage workers is statistically significant at the p 0.01 level.
Have the characteristics of low-wage workers changed over time?
- The individual and family characteristics of low-wage workers in 2001 are very similar to the characteristics of low-wage workers in 1996 reported in prior research (Schochet and Rangarajan 2004). In 1996, low-wage workers were disproportionately female, young, nonwhite, with a health-related work limitation, and with lower levels of education. They were also more likely to be unmarried and live in poor families. We find little evidence of any substantial change in the specific levels of these characteristics among low-wage workers between 1996 and 2001.
- Our analysis finds almost no substantial differences between the individual and family characteristics of low-wage workers in 2001 and 2003.
Do the characteristics of key subgroups of low-wage workers differ from all low-wage workers?
- The key subgroups we examineunmarried mothers, less-educated black men, and low-wage workers in low-income familieshave different individual and family characteristics than all low-wage workers. Low-wage workers in each of these subgroups are disproportionately younger and less-educated. Low-wage workers in low-income families and less-educated black men are disproportionately more likely to be unmarried with children than all low-wage workers.
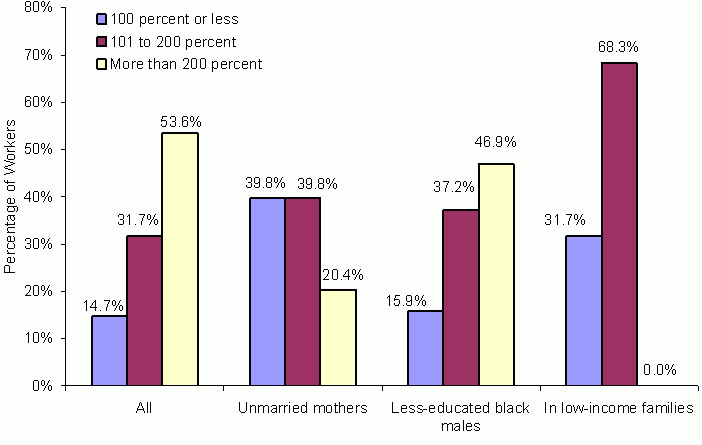
- Compared with all low-wage workers, low-wage workers in these subgroups are more likely to be living in a poor family (exhibit ES-3). This is consistent with the finding that workers in these groups (except less-educated black men) are significantly less likely to have another employed adult in the family.
Exhibit ES-3:
Income as a Percentage of the Poverty Threshold for Low-Wage Workers in January 2001, by Population Subgroup
Source: Authors tabulations of the 2001 SIPP panel.
Note: The difference between all low-wage workers and each low-wage worker subgroup is statistically significant at the p 0.01 level.
What are the characteristics of low-wage workers jobs?
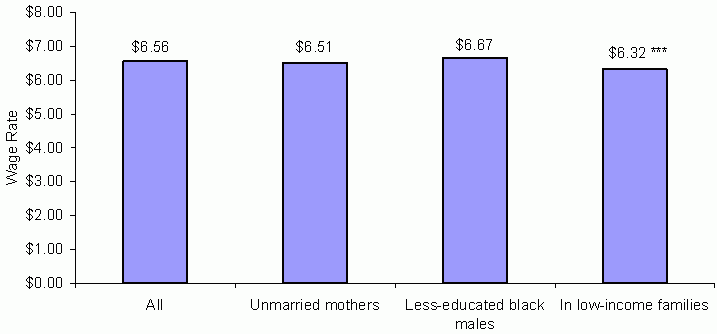
- By definition, low-wage workers in this study made less than $8.63 in 2001. But many of these workers earned far less per hour than this cutoff. On average, workers falling into the low-wage category in 2001 earned $6.56 an hour, and more than a third of all low-wage workers earned less than this an hour. This is compared with the average hourly wage of all higher-wage workers of $17.65.
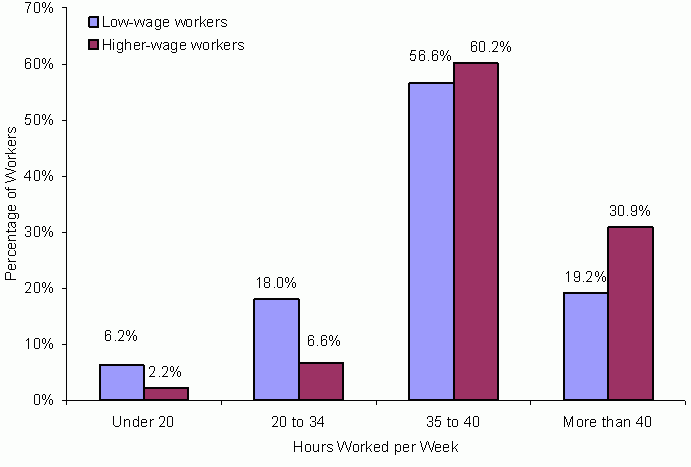
- The average low-wage worker works full-time hours (38 hours a week), but a substantial fraction work part time. Of all low-wage workers, 18.0 percent work between 20 and 34 hours a week, and 6.2 percent work less than 20 hours a week (exhibit ES-4). However, 10.9 percent of all low-wage workers report they are working part time involuntarily; that is, they were seeking but could not find full-time work. This is compared with only 3.4 percent of higher-wage workers.
Exhibit ES-4:
Usual Weekly Hours Worked for Workers in January 2001
Source: Authors tabulations of the 2001 SIPP panel.
Note: The difference between low-wage workers and higher-wage workers is statistically significant at the p 0.01 level.
- Low-wage workers are more likely than higher-wage workers to be working part time, in nonunionized jobs, and in small firms. These characteristics are part of the explanation for why these jobs are lower paying. Low-wage workers are also less likely to have employer-sponsored health insurance. Only 55.6 percent of low-wage workers have this type of coverage, compared with 87.8 percent of higher-wage workers.
- There are substantial differences in the occupations and industries of the jobs low-wage workers hold and those of higher-wage workers. Low-wage workers jobs are more likely to be in service and sales occupations and are less likely to be in professional/technical occupations than higher-wage workers. Low-wage jobs are more likely to be in the wholesale/retail trade industries and less likely to be in manufacturing or public administration.
Have the types of jobs held by low-wage workers changed over time?
- At $6.45, the average hourly wage of all low-wage workers in 2003 was slightly lower than the average hourly wage of low-wage workers of $6.59 in 2001 (in 2001 dollars). Over the same period, average hourly wages of all non-low-wage workers increased from $17.65 to $18.13.
- The job characteristics of low-wage workers compared with higher-wage workers are largely unchanged between 2001 and 2003.
- Comparison to earlier research shows that low-wage workers in 1996 were also disproportionately more likely to work part time and work multiple jobs, and less likely to be in a union or have employer-provided health insurance, than higher-wage workers.
- However, there are some specific differences in the types of jobs held by low-wage workers in 1996 versus 2001. The share of low-wage workers working multiple jobs is somewhat higher in 2001 than in 1996, 11.1 percent compared with 8 percent. The share with employer-provided health insurance is also somewhat higher in 200155.6 percent in 2001 compared with 50 percent in 1996. And although the distributions of occupation and industry are similar, a somewhat higher percentage of low-wage workers worked in service professions in 1996 than in 2001 (33 percent compared with 26.2 percent), with the difference made up by construction and professional/technical occupations in 2001.
Do key subgroups of low-wage workers hold different types of jobs?
- Average hourly wages of unmarried mothers, less-educated black men, and workers in low-income families differ only marginally from all low-wage workers. For example, low-wage workers in low-income families earn an average of $6.32 an hour in 2001, compared with $6.56 for all low-wage workers (exhibit ES-5).
- For the most part, the types of jobs held by low-wage workers in these key subgroups are similar to all low-wage workers. However, unmarried mothers and low-wage workers in low-income families are even less likely to have employer-provided health insurance than all low-wage workers.
Exhibit ES-5:
Average Hourly Wage Rate of Low-Wage Workers in January 2001
Source: Authors tabulations of the 2001 SIPP panel.
Note: Statistical significance is calculated on the difference in average hourly wage between all low-wage workers and each other group in each year.
* = p 0.1, ** = p 0.05, *** = p 0.01.
What is the health insurance coverage of low-wage workers?
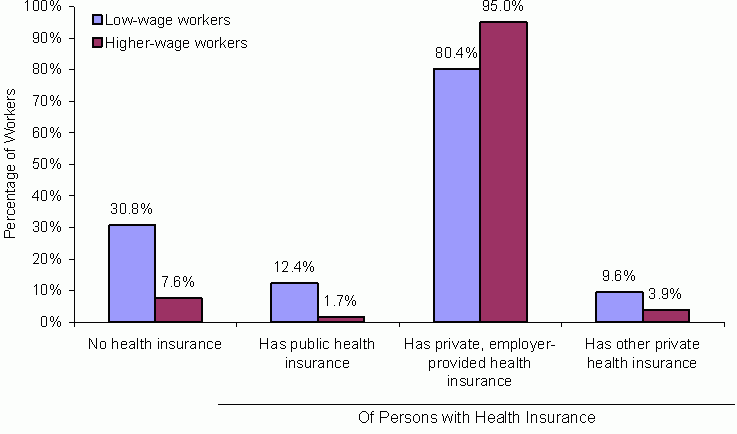
- Low-wage workers are much more likely to be without any health insurance coverage than higher-wage workers. In 2001, 30.8 percent of low-wage workers were without health insurance coverage, while only 7.6 percent of higher-wage workers lacked coverage (exhibit ES-6).
Exhibit ES-6:
Health Insurance Status for Workers in January 2001
Source: Authors tabulations of the 2001 SIPP panel.
Note: 2.39 percent of low-wage workers and 0.58 percent of higher-wage workers in January 2001 have some combination of public and private health insurance coverage,
and thus are double counted here. The difference between low-wage workers and higher-wage workers is statistically significant at the p 0.01 level.
- For those who have coverage, employer-provided health insurance is by far the most common source for all workers. But even so, low-wage workers with health insurance are much less likely to have employer-provided health insurance than higher-wage workers.
- The same patterns are true in 2003, although the percentage of workers without health insurance coverage went up slightly for low-wage and higher-wage workers.
Low-Wage Workers Wage Progression
How many low-wage workers move into higher-wage jobs over time?
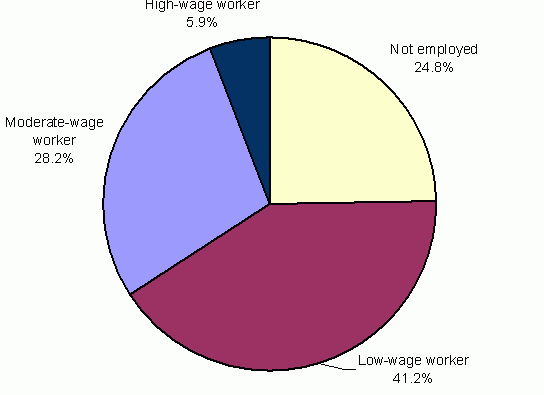
- Over 40 percent of low-wage workers in January 2001 remained low-wage workers in January 2003, and 24.8 percent were not working at all (exhibit ES-7). About a third were working at higher-wage jobs in January 2003, with 28.2 percent working in moderate-wage jobs (wages between $8.63 and $17.26 an hour) and 5.9 percent working in high-wage jobs (over $17.26 an hour).[3]
- The average low-wage worker spent 53.5 percent of the months between January 2001 and January 2003 in low-wage jobs, 23.8 percent of the months in moderate-wage jobs, 5.1 percent in high-wage jobs, and 17.5 percent of the months not working at all.
Exhibit ES-7:
Employment Status in January 2003 of Low-Wage Workers in January 2001
Source: Authors tabulations of the 2001 SIPP panel.
- Low-wage unmarried mothers and low-wage workers in low-income families showed slightly less progress than the average low-wage worker. About 47 percent of low-wage workers in these groups in January 2001 were also low-wage workers two years later, while less than 30 percent earned moderate or high wages. For less-educated African American men, progress is even worse. Over one-third of these low-wage men were not working in January 2003.
How much wage growth do low-wage workers experience?
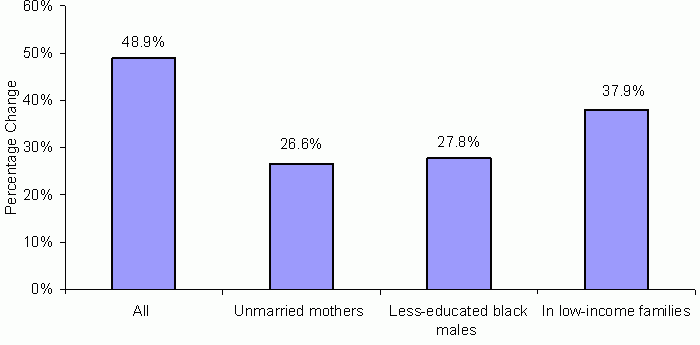
- On average, low-wage workers in 2001 who were also employed in 2003 earned $6.59 in 2001. By 2003, this group of workers earned on average $9.82 an hour. This is an increase of almost 50 percent. By definition, this excludes the quarter of low-wage workers in 2001 who were not working in 2003.
- Growth in average wages between 2001 and 2003 for key subgroups is substantially lower than for all low-wage workers (exhibit ES-8). The average wage growth was 26.6 percent for unmarried mothers, 27.8 percent for less-educated black men, and 37.9 percent for low-wage workers in low-income families. While wage growth was higher for low-wage workers in low-income families than the other subgroups, it was still lower than for all low-wage workers.
Exhibit ES-8:
Change in Wage Rate among Low-Wage Workers in January 2001 Who Are Working in January 2003
Source: Authors tabulations of the 2001 SIPP panel.
Note: Each low-wage workers subgroups wage rate in 2001 is statistically signifcantly different (at the p 0.01 level) from its wage rate in January 2003.
Who moves from low-wage to higher-wage employment?
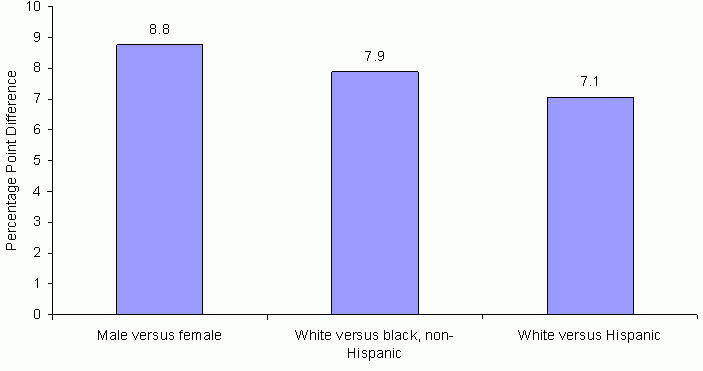
- Based on the findings of multivariate analyses, low-wage workers who are male, white, living in metropolitan areas, working full time, or working in larger firms are significantly more likely to move to higher-wage employment (earning more than $8.63 in 2001 dollars) than those who are not (exhibit ES-9).[4] The likelihood that a male low-wage worker moves to a higher wage status between January 2001 and January 2003 is 8.8 percentage points higher than that of a woman. Black and Hispanic low-wage workers are 7.9 and 7.1 percentage points (respectively) less likely to move up than whites. By and large, family characteristics such as the number of adults and children present, the age of the youngest child, and marital status are not significantly related to advancement.
Exhibit ES-9:
Predicted Percentage Point Difference in the Probability of Moving to Higher-Wage Employment
Source: The 2001 SIPP panel.
Notes: The sample is low-wage workers in January 2001 who are observed in the data in January 2003.
The results are generated from a regression model; the dependent variable is 0 if the worker is not employed or is still low wage in January 2003
and 1 if the worker is a higher-wage worker in January 2003.
Estimates are statistically significant at the p 0.01 level and can be found in the report in exhibit IV-7, model 1.
- Low-wage workers education is also related to their prospects for advancement. Compared with low-wage workers without high school degrees, those with high school educations (only) are 7.8 percentage points more likely to move to a higher wage status over the two-year study period. In turn, those with college degrees are 10.6 percentage points more likely to advance than those with only high school educations.
- Certain occupations offer more potential for advancement than others. For example, compared with sales occupations, those working as professionals are 8.8 percentage points more likely to move to a higher wage status in two years, while those in service occupations are 6.3 percentage points less likely to do so. A similar pattern emerges when we consider industry. Compared with those working in wholesale or retail trade, those working in construction are 12.1 percentage points more likely to advance.
- The stronger the job market, as measured by statewide unemployment rates, the more likely a low-wage worker will advance to a higher wage status. A one percentage point decrease in statewide unemployment rates is associated with a 2.4 percentage point increase in advancement. Each $1,000 increase in annual state per capita income is associated with a 0.5 percentage point increase in the probability that a low-wage worker becomes a higher-wage worker in two years time.
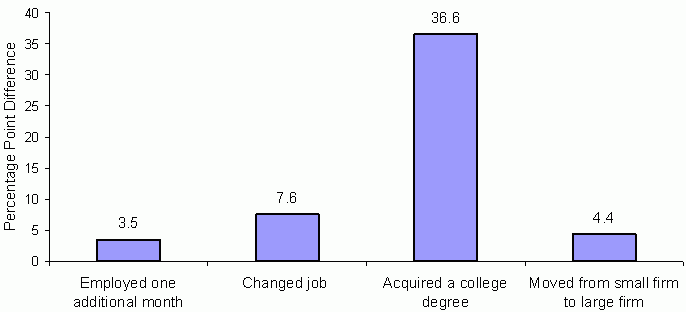
- Experience is an important indicator of advancement. Our multivariate models suggest that for each additional month of experience over the two-year period, the chance of advancing to a higher wage status rises by 3.5 percentage points. Given the distribution of work experience of low-wage workers in our sample, however, this large estimated effect likely reflects the vastly lower experience levels accrued by those who are no longer working in January 2003 compared with those still working at the end of the period, rather than true incremental benefit of working an additional month.
- Changing jobs is associated with movement to a higher wage status. Workers who change jobs are 7.6 percentage points more likely to move into a higher wage status than those who do not change jobs. Low-wage workers who change jobs are more likely to move up in status than those who do not even if their new jobs are in different industries and occupations than their previous jobs (exhibit ES-10).
Exhibit ES-10:
Predicted Percentage Point Difference in the Probability of Moving to Higher-Wage Employment
Source: The 2001 SIPP panel.
Notes: The sample is low-workers in January 2001 who are present in the data in January 2003.
The results are generated from regression models;
the independent variable is 0 if the worker is not employed or still low wage in January 2003 and 1 if the worker is a higher-wage worker in January 2003.
Employed one additional month and changed jobs is taken from exhibit IV-7, model 3.
Acquired a college degree is taken from exhibit IV-7, model 4.
Estimates are statistically significant at the p 0.01 level.
- Completing a college degree and becoming a full-time worker contribute to advancement. The probability of advancement is 36.6 percentage points higher for those acquiring a college degree than for those whose educational attainment does not change (exhibit ES-10). Experiencing an increase in employer size (from less than 25 to 100 or more), either through job change or because the employer expands, is also associated with advancement. Finally, the onset of a health-related work limitation reduces the prospects for advancement by 3.5 percentage points.
What factors are associated with wage growth?
- Many of the same factors associated with moving to higher wage status are also associated with wage growth generally. Low-wage workers who are male, white, have higher levels of education, and work full time are more likely to experience wage growth than those who are not. Wage growth is higher for those working in sales occupations than for those working in administrative, service, and craft occupations, but it is lower than for those in professional occupations. Compared with most every other industry, wage growth is consistently lower for those in wholesale and retail trade.
- Completing a college degree is strongly associated with wage growth. Other changes associated with wage growth include aging into ones 40s, becoming a full-time worker, and leaving a service occupation.
- Because our wage growth analysis is restricted to individuals who worked in both January 2001 and January 2003, there is less variation in the work experiences of individuals included in these analyses than in the wage status analyses that include individuals who are no longer working. As such, some factors correlated with changes in wage status, such as experience and changing jobs, are not significantly correlated with wage growth.
Low-Wage Workers Progress toward Self-Sufficiency
The analysis in this section is limited to low-wage workers in low-income families, those who are most likely to receive government benefits. Here we examine families total income and earnings, as well as their receipt of government benefits and work supports. We also examine their level of self-sufficiency using a self-sufficiency index, defined as the ratio of family earnings to family needs, with family need determined by the federal poverty threshold.
How much of low-wage workers family income comes from earnings versus government benefits?
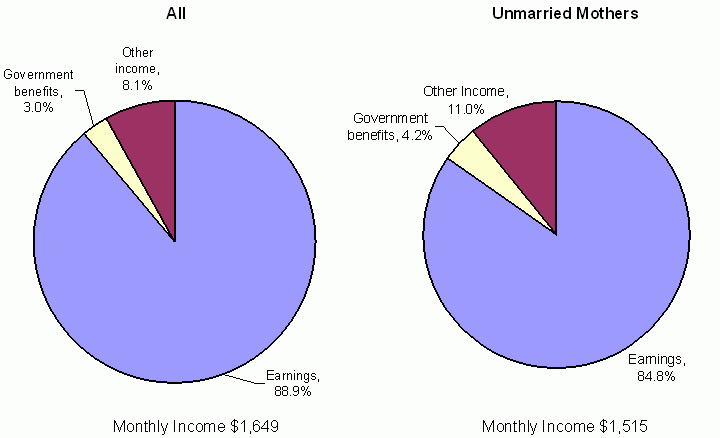
- Among low-wage workers in low-income families, the vast majority of family income is from earnings, and only small amounts are from other income, such as child support and interest income, or government benefits, such as Temporary Assistance for Needy Families (TANF) and Supplemental Security Income (SSI). Among low-wage workers in low-income families in January 2001, earnings accounted for 88.9 percent of income, while other income and government benefits accounted for 8.1 and 3.0 percent, respectively (exhibit ES-11). Even when the value of food stamps and the EITC is added to income to create an enhanced income measure, earnings still make up over 80 percent of income.
- Low-wage working unmarried mothers who were in low-income families in January 2001 have somewhat lower incomes and earnings than all low-wage workers in low-income families. But, even among this disadvantaged population, earnings make up 84.8 percent of income and 74.6 percent of enhanced income.
Exhibit ES-11:
Low-Wage Workers Family Incomes in January 2001
Source: Authors tabulation of the 2001 SIPP panel.
Note: Sample includes low-wage workers in low-income families in January 2001 who are also observed in January 2003.
Have family income levels and the composition of income of low-wage workers in low-income families changed over time?
- Low-wage workers in low-income families experienced an increase in family income and earnings between January 2001 and January 2003. Consistent with the dominance of earnings in the composition of income, earnings are the major source of these income increases. The earnings of these families increased despite a slight decline in the average hourly wage rate between 2001 and 2003.
How many low-wage workers in low-income families receive government benefits or work supports?
- The vast majority of low-wage workers in low-income families does not receive government benefits or work supports (exhibit ES-12).[5]
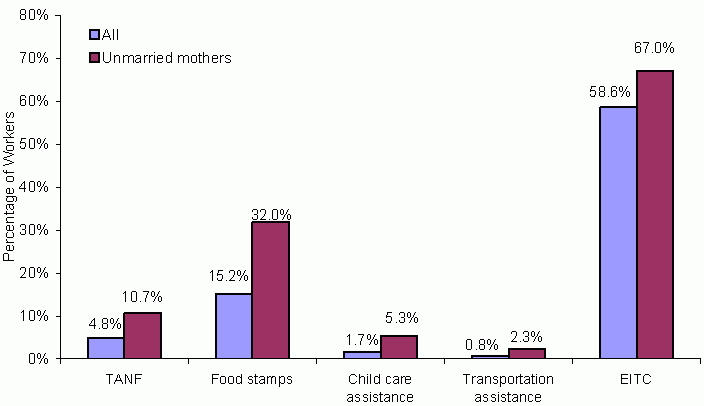
- In January 2001, less than 5 percent of low-income low-wage worker families received TANF. Low-wage working unmarried mothers in low-income families are more likely to receive TANF, although TANF recipients are still in the minorityonly 10.7 percent received TANF.
- Families are more likely to receive food stamp benefits than TANF benefits.[6] Fifteen percent of low-wage workers in low-income families received food stamp benefits in January 2001, while 32.0 percent of low-wage unmarried mothers in low-income families received food stamps. The average monthly food stamp benefit among recipients was about $230, lower than the average TANF benefit of roughly $300.
Exhibit ES-12:
Receipt of Government Benefits and Work Supports Low-Wage Workers in Low-Income Families in January 2001
Source: Authors tabulations of the 2001 SIPP panel.
Notes: The percentages reported in this exhibit are likely lower than the true percentages
because SIPP respondents have been shown to underreport receipt of government benefits.
The EITC value captures the percentage eligible to collect the EITC and
is calculated using the National Bureau of Econmic Research (NBER) TaxSim model and 2001 annual income.
- Child care and transportation work supports are received by just a tiny fraction of low-wage low-income workers.[7] Among all low-wage workers in low-income families in January 2001, only 1.7 percent were in families that received child care assistance, and only 0.8 percent were in families that received transportation assistance. Receipt was also low among low-wage unmarried mothers in low-income families5.3 percent and 2.3 percent, respectively.
- The majority of low-wage low-income workers were eligible to receive the EITC in 2001, with somewhat higher rates of eligibility among unmarried mothers. While 58.6 percent of all low-wage workers in low-income families were eligible for the EITC, 67.0 percent of low-wage unmarried mothers in low-income families were eligible.[8] The higher rate of EITC eligibility among unmarried mothers is likely because unmarried mothers are in families with children, while many low-income families do not include children.
Do self-sufficiency levels differ across low-wage workers by characteristics?
- Low-wage unmarried mothers in low-income families have lower levels of self-sufficiency than the broader population of all low-wage workers in low-income families. The average self-sufficiency level in January 2001 was 0.88 for low-wage unmarried mothers, but 1.1 for all low-wage workers.
- Numerous individual and family characteristics are associated with higher levels of self-sufficiency among low-wage workers in low-income families. These include being white, having higher education levels, living in a married-couple family, having more adults in the family, having fewer children in the family, having no one in the family with a health-related work limitation, and living in a metropolitan area.
Low-Wage Workers Work Supports and Self-Sufficiency
Does self-sufficiency differ by receipt of work supports?
- Among low-wage workers in low-income families in January 2001, self-sufficiency was lower for persons receiving child care or transportation assistance than for persons not receiving these work supports. The self-sufficiency index (the ratio of family earnings to family needs) was 0.88 for those receiving a work support, while it was 1.11 for those not receiving a work support. This pattern arises because those who are most needy are more likely to be eligible for and take-up government supports. More sophisticated statistical models are needed to sort out the actual impact of work supports on self-sufficiency for those who are receiving them.
- The self-sufficiency index is similar for unmarried mothers in low-income families receiving and not receiving work supports0.87 and 0.90, respectively.
Does use of work supports improve low-wage workers self-sufficiency?
In this section, multivariate statistical models are used to examine whether work supports improve low-wage workers self-sufficiency. We estimate two types of models that are designed to address the problems inherent in simple comparisons.[9]
- We find no evidence that the receipt of child care assistance increases self-sufficiency among all low-wage workers in low-income families. However, among low-wage unmarried mothers in low-income families, we find evidence that receipt of child care assistance increases self-sufficiency. Our results suggest that child care receipt is associated with an increase in self-sufficiency of 3.6 percent, or $625 a year for a single-mother family living at the federal poverty threshold. Based on our estimation approach, these values are likely lower-bound estimates of the true effect of child care receipt on self-sufficiency.[10]
- We find no evidence that transportation assistance increases families self-sufficiency. Because of methodological challenges and limitations in our analysis, this is still an open question.
- We find no evidence that the EITC increases families self-sufficiency. This finding may be because the data for this analysis are limited to the early 2000s, when there were only modest changes to the EITC. It is possible that analyses based on data from the 1990s (when large EITC expansions occurred) through the mid-2000s would find that the EITC increases self-sufficiency.
Taken together, the results of this study provide evidence that low-wage workers can progress in terms of wages and the self-sufficiency of their families. However, while some families progress, many families do not. Progress tends to be more limited for low-wage workers who are single mothers and less-educated black men, as well as those in low-income families. Our analysis of movement from a low-wage to a higher-wage status suggests that workers who are most likely to progress are those who spend the most time working. The importance of sustained employment for advancement is of particular concern as unemployment and joblessness in 2009 rise to levels not seen in decades. Importantly, we find some evidence that government-provided work supports, in particular child care assistance, improve the self-sufficiency of low-wage unmarried mothers in low-income families. Given the methodological challenges, it is encouraging that our analysis provides some evidence that work supports can improve the well-being of low-income families. Currently, very few low-wage workers in low-income families receive government-provided work supports, and increasing the receipt of supports could improve the lives of these families.
[ Go to Contents ]
Endnotes
[1] In the report, we also include information for a fourth group, working unmarried mothers in low-income families. For clarity, this group is not included in the executive summary.
[2] Specifically, we estimate individual-level fixed effects models and instrumental variable (IV) models. For a fuller discussion of our modeling techniques and potential selection bias and endogeneity problems, please see the full report.
[3] Dollar values are for 2001.
[4] The results presented in this section on worker and job characteristics are drawn from model 1 in exhibit IV-7, while the results on experience and job change are drawn from model 3 in exhibit IV-7.
[5] The reported rates of receipt presented in exhibit ES-12 are likely lower than the true rates because SIPP respondents have been shown to underreport receipt of government benefits. Research on food stamp participation, for example, has found that the SIPP underreports food stamp receipt by 7 percent to 19 percent (Bitler, Currie, and Scholz 2002; Cody and Tuttle 2002). An analysis of SIPP child care data suggests that the underreporting of child care benefit receipt is substantially higherover 40 percent (Besharov, Morrow, and Shi 2006). However, the benefit receipt rates would still be low (with the exception of food stamps) even if the true benefit receipt rates were twice as high as the rates reported below.
[6] The 2008 Farm Bill renamed the Food Stamp Program (FSP) the Supplemental Nutrition Assistance Program (SNAP). Because our data are from before 2008, we refer to this program as the Food Stamp Program throughout this report.
[7] Although the percentage of low-wage workers in low-income families who report receiving child care assistance in the SIPP is quite low, spending on child care subsidies is not. In 2001, about $11.1 billion was spent on child care subsidies through TANF, Social Service Block Grant (SSBG), and Child Care and Development Fund (CCDF) related programs (including federal and required state matching funds). As mentioned above, research suggests that the SIPP underreports the receipt of child care subsidies by more than 40 percent (Besharov, Morrow, and Shi 2006).
[8] Families with multiple children can have incomes below 200 percent of the poverty threshold and be ineligible to receive the EITC. In 2001, for example, families with one adult and three children that had incomes above 190 percent of the poverty threshold were ineligible to receive the EITC. The same was true for families with two adults and two children. Also, some low-income families in our sample were ineligible for the EITC in 2001 because they experienced increases in income and earnings over calendar year 2001. Low-wage workers in low-income families are defined based on their wage rate and income in January 2001. EITC eligibility, however, is calculated based on families calendar year 2001 income and earnings.
[9] We estimate individual-level fixed effects models and instrumental variable (IV) models. These models and their limitations are discussed in more detail in section II of the report.
[10] This result is from our individual-level fixed effects model.
