Contents
- Study Regions
- Basic Findings on Employment and Wages
- Approach to Measuring the Impact of Welfare Reform on Labor Markets
- Effect of Shift in Demand and Shift in Supply on Employment and Wages
- Effect of Welfare Reform on Employment and Wages
- Projecting the Effect of a Recession
- Summary and Implications for Further Research
Since 1993, welfare recipients have been leaving the welfare rolls for work in record numbers. From January 1993 to January 1998, welfare caseloads declined by 33 percent nationally, and several studies have estimated that over half of the adults who have left welfare have entered the labor market.(1) The inflow of welfare recipients into the labor market can be attributed to two basic factors: welfare reform and the strong economy. Welfare reform is widely perceived to have begun with the passage of the Personal Responsibility and Work Opportunity Reconciliation Act (PRWORA) in mid-1996, which increased the number of welfare recipients who were required to seek work. But even prior to this legislation, many states were reshaping their Aid to Families with Dependent Children (AFDC) programs under waivers, which likely increased the number of welfare recipients entering the labor force in at least some of these states. In addition, the strong economy from 1993 to 1998 increased the availability of low-skill jobs and undoubtedly lured many welfare recipients into the low-skill labor market.
Several other factors may have contributed to changes in labor market participation of welfare recipients and are worth mentioning. First, the federal government expanded the Earned Income Tax Credit (EITC) for working low-income families in the early- and mid-1990s, which most likely encouraged some welfare recipients to enter the labor force. Second, the minimum wage increased in 1997, which could have offset downward wage pressure from the entry of welfare recipients into the labor force. Third, some regions of the country experienced significant changes in population, which reduced or increased the number of low-skill workers in these areas. Finally, the recession of the early 1990s created a pool of unemployed low-skill workers who were available to take new jobs when the economy began to recover.
Policy-makers have been concerned about whether enough jobs will be available to employ the additional welfare recipients entering the labor market as a result of welfare reform. If a surplus of jobs is not available in particular areas, welfare recipients entry into the labor force might reduce low-skill wages and displace some workers. Policy-makers are especially concerned about the impact of welfare reform on rural and small metropolitan labor markets, because these markets might be less able to absorb the inflow of welfare recipients than urban labor markets.
The Assistant Secretary for Planning and Evaluation (ASPE) in the Department of Health and Human Services (DHHS) contracted with The Lewin Group to examine how well rural and small metropolitan labor markets can absorb welfare recipients, and to the extent feasible, estimate the impact of welfare reform on rural and small-metropolitan regions since 1993. This study uses an economic model to estimate the impact of welfare reform and improvements in the economy on the low-skill labor market, where most welfare recipients seek work. A major challenge facing researchers in this area is to distinguish between entry due to reforms (welfare push) and entry due to the strong economy (demand pull). This decomposition is necessary if we are to anticipate future conditions in the low-skill labor market, when the economy might not be so strong. We attempted such a decomposition in this report.
Study Regions
We selected 12 regions for this study, which include a mix of rural and small metropolitan areas (the latter are defined as having fewer than 200,000 residents). The regions vary widely in population characteristics and labor market conditions and implemented a wide range of welfare policies. We considered only areas for which we could obtain required labor and welfare data and that were large enough in size for meaningful statistical analysis. In several instances, this meant combining neighboring counties to obtain a region that had an adequate size population. The study regions are listed below.
| Decatur and Florence , Alabama: two of the smallest metropolitan statistical areas (MSAs) in Alabama including Colbert, Lauderdale, Lawrence, and Morgan counties. | Central Oregon: a nonmetropolitan area including Crook, Deschutes, and Jefferson counties in central Oregon. |
| Rural Mississippi: encompasses the entire state, except Biloxi and Jackson MSAs. It is comprised primarily of nonmetropolitan areas. | Medford-Ashland, Oregon: a small MSA in southwest Oregon encompassing Jackson County. |
| Joplin, Missouri: a small MSA in southwest Missouri, including Jasper and Newton counties. | Florence, South Carolina: a small MSA encompassing Florence county. |
| Southeast Missouri: a non- metropolitan area including 23 counties in southeast Missouri. | Vermont: the entire state; includes one small MSA (Burlington) and nonmetropolitan areas. |
| Jamestown, New York: a small MSA in southwest New York, encompassing Chautauqua County. | Eau Claire, Wisconsin: a small MSA that includes Eau Claire and Chippewa counties. |
| North Country, New York:seven counties in the most northern region of New York. | Wausau, Wisconsin: a small MSA in central Wisconsin encompassing Marathon County. |
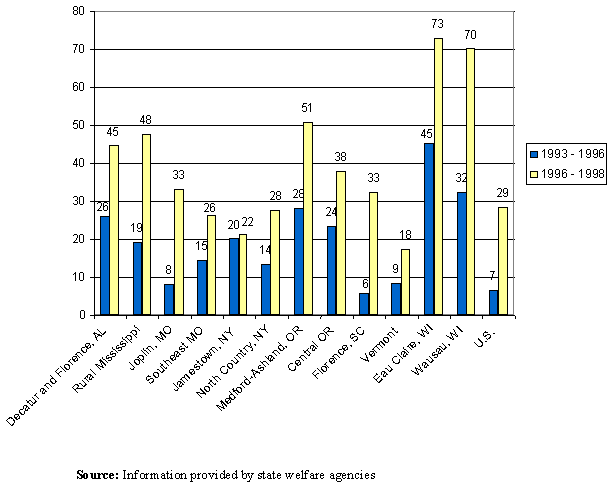
Because of variation in the demographics, economic conditions, and welfare policies across the regions, we observed variation in the percent reduction in welfare caseloads. As Exhibit ES.1 shows, all regions experienced reductions in the number of families receiving cash assistance, and most of the regions experienced steeper declines than the U.S. average. In addition, some regions experienced particularly large reductions. Eau Claire and Wausau, Wisconsin reduced caseloads by 45 and 32 percent, respectively, between 1993 and 1996 and another 73 and 70 percent between 1996 and 1998. Medford-Ashland, Oregon, Decatur and Florence, Alabama, and Rural Mississippi also experienced significant reductions. Vermont experienced a relatively small caseload reduction, perhaps due to the statewide waiver that allowed welfare recipients with higher earnings to continue to receive cash benefits.
Exhibit ES.1
Percent Reductions in AFDC/TANF Caseloads
Basic Findings on Employment and Wages
Our approach begins by comparing the increase of welfare recipients entering the labor market to changes in the low-skill labor force in each of the regions. Essentially, we attempted to answer the following question: Were there enough jobs to absorb the increase of welfare recipients who left for work or who combined welfare and work?
We examined employment and wages at three points in time: 1993, 1996, and 1998. Between 1993 and 1996, we expected to see the effect of the stronger labor market as well as the effect of federal waivers and possible anticipation of PRWORA. Between 1996 and 1998, we expected to see the beginning effects of PRWORA along with the effects of continued growth in the economy. The findings are as follows:
- Low-skill employment increased from 1993 to 1996 and from 1996 to 1998 in almost all regions, although the magnitude of the increase varied by region.
For this study, we defined low-skill employment to include employment in occupations requiring less than one month of on-the-job training and no postsecondary education. Low-skill employment grew at a faster rate than employment in higher-skill occupations. Growth of low-skill employment varied by region, ranging from relatively small increases in the New York regions (and negative growth in North Country between 1993 and 1996) to large increases in the Oregon regions.
- Real wages for low-skill workers declined between 1993 and 1996 in many of the regions, but increased from 1996 to 1998 in all regions.
Between 1993 and 1996, real wages declined in 8 of the 12 regions, with an average annual decline in wages of 0.1 percent. Between 1996 and 1998, wages increased in all regions, with an average annual increase of 1.1 percent. The study regions experienced lower wage growth, on average, than the United States, which experienced no decline between 1993 and 1996 and a 1.9 percent increase between 1996 and 1998. The slower wage growth in the study regions might be due to the characteristics of the population and the trends in industry growth. As is true of rural areas nationally, the share of employment in the manufacturing sector in the study regions declined from 1993 to 1998 and was replaced, in part, by employment in the service sector, which traditionally pays lower wages.
- The increase in low-skill jobs exceeded the number of welfare recipients entering the labor force in all but one region. While welfare recipients have been leaving welfare for employment in record numbers, they comprise only a fraction of the employment increase.Because unemployment was not increasing during this period, it appears that rural labor markets were able to absorb the increase of welfare recipients.
Exhibit ES.2 presents estimates of the number of welfare recipients newly entering employment and the increase in low-skill employment. The estimate of welfare recipients includes former and current recipients and nets out the number who were in the labor force in 1993.(2) It also includes individuals who would have entered welfare, but who were diverted from receiving benefits, either because of the growth of the economy or the welfare reform provisions.(3)
As this exhibit shows, the increase in low-skill employment exceeded the number of welfare recipients entering the labor force for all regions, except North Country, between 1993 and 1996.(4) The average employment growth accounted for by welfare recipients in these regions is roughly 10 percent from 1993 to 1996 and 24 percent from 1996 to 1998. Coupled with the fact that unemployment declined in each of these regions between 1996 and 1998, it appears that the regions could accommodate the inflow of welfare recipients.
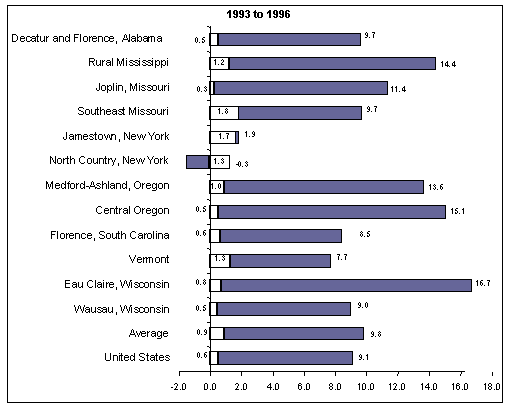
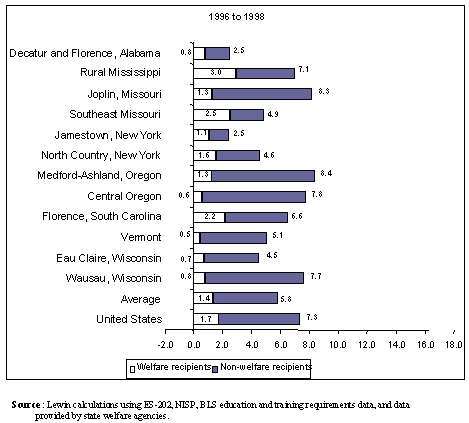
Overall, the increase in low-skill employment during the 1993 to 1996 period dwarfed the increase of welfare recipients in the labor market. With the exception of Vermont, the study regions implemented waivers to the AFDC program too late to have had much impact on welfare caseloads during this period. We analyze the 1993 to 1996 period in the body of the report, but limit the remaining discussion here to the 1996 to 1998 period, when welfare reform was clearly a more important factor.
Approach to Measuring the Impact of
Welfare Reform on Labor Markets
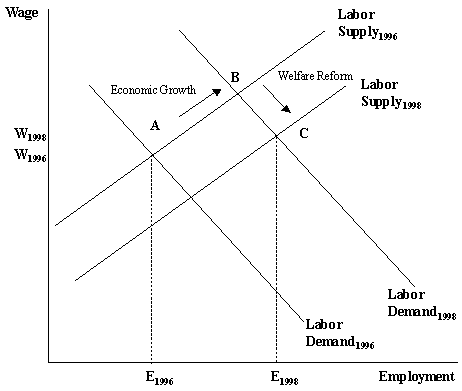
We attempted to estimate the separate contributions of welfare reform and the improved economy to changes in employment and wages in each of the regions. The effect of welfare reform is represented by a shift in the labor supply curve at every wage, more individuals are seeking work, due to the new welfare policies (see Exhibit ES.3). The improvement in the economy is represented by a shift in the labor demand curve at every wage, employers are seeking to hire more workers than previously. In Exhibit ES.3, under a scenario of economic growth, but without welfare reform, we move from Point A to Point B; welfare reform pushes us to Point C.
Exhibit ES.3
Demand and Supply for Low-Skill Labor
We applied the economic model described above, using employment and wage data collected from U.S. Department of Labors Bureau of Labor Statistics (BLS) and state employment security agencies (SESAs), and welfare data collected from state welfare agencies covering the 12 study regions.
Distinguishing between the effects of welfare push and demand pull is difficult, for several reasons. One is that, for the most part, these areas still had historically high unemployment rates in 1993, following the 1991 recession. Hence, they could be reasonably characterized as having an excess supply of labor at going wage rates, which makes application of the demand/supply analysis problematic. In addition, factors other than welfare reform and economic expansion affected some of these areas low-skill labor markets during this period. We are aware of three such factors: expansion of the EITC, population growth, and increases in the minimum wage.
Effect of Shift in Demand and Shift in Supply
on Employment and Wages
- The economic expansion, which increased the demand for labor, played a much larger role in increasing low-skill employment than the shift in supply.
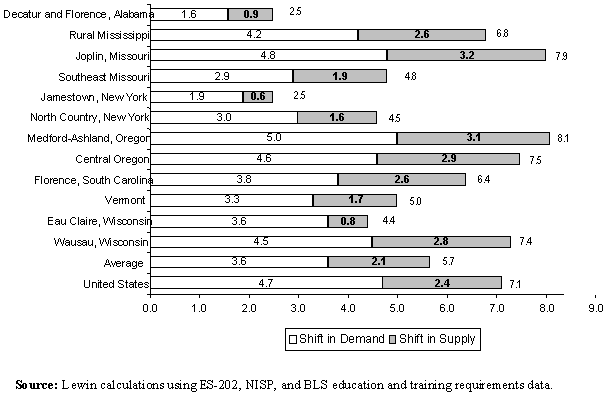
We decomposed the percentage change in employment into the percentage change as a result of the shift in demand, primarily due to the economic expansion, and the percentage change as a result of the shift in supply, which included both the effects of welfare reform and the effects of other factors, which are discussed below. Between 1996 and 1998, about two-thirds of the increase in employment in these regions was due to the shift in demand and one-third was due to the shift in supply (see Exhibit ES.4). The shift in demand accounted for the greatest share of employment increase in Eau Claire, Wisconsin (82 percent) and the smallest share in Florence, South Carolina (59 percent).
Exhibit ES.4
Percent Change in Employment in Low-Skill Labor Markets, 1996-1998
- The shift in labor supply slowed wage growth, although wages continued to increase as a result of the economic expansion.
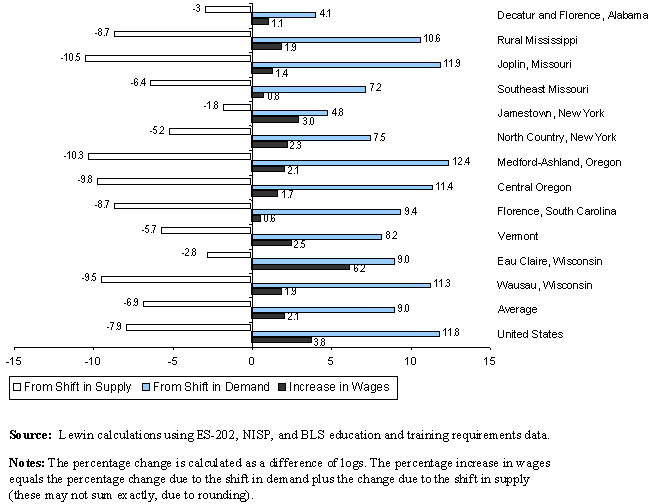
Exhibit ES.5 decomposes the percentage change in wages into the percentage change as a result of the shift in demand (the economic expansion), and the percentage change as a result of the shift in supply (welfare reform, along with other supply factors). As this exhibit shows, between 1996 and 1998, the greater effect of economic expansion offset any reduction in wages due to the shift in the supply.
Exhibit ES.5
Percent Change in Wages in Low-Skill Labor Markets, 1996-1998
Effect of Welfare Reform on Employment and Wages
- Welfare reform likely increased employment and slowed wage growth, but the effects were small relative to the effects of the economic expansion and other factors that increased the supply of low-skill labor.
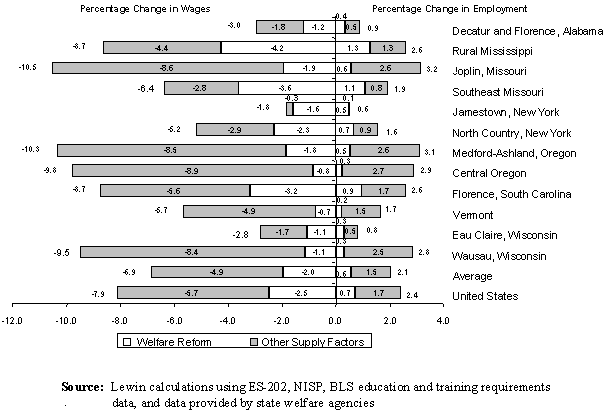
In the discussion above, we noted that the effect of the shift in supply on employment and wages part of which was due to welfare reform was smaller than the effect of the economic expansion. We separated out the effect of welfare reform from other factors that contributed to the shift in supply. For this analysis, we assumed that the increase of welfare recipients in the labor force was a direct result of welfare reform, although clearly this overestimates the effect of welfare reform because some of the increase of welfare recipients in the labor force is due to the economic expansion and other factors. However, even using this inflated estimate, Exhibit ES.6 shows that welfare reform in the study regions increased employment by only 0.6 percent, and reduced wage growth by 2 percentage points. This is less than one-third of the effect, on average, of other supply factors. Also, as we saw above, the effect on employment and wages from the economic expansion exceeded the effect from the entire shift in labor supply.
- Population growth and net job loss from the 1991 recession also contributed to the outward shift in labor supply.
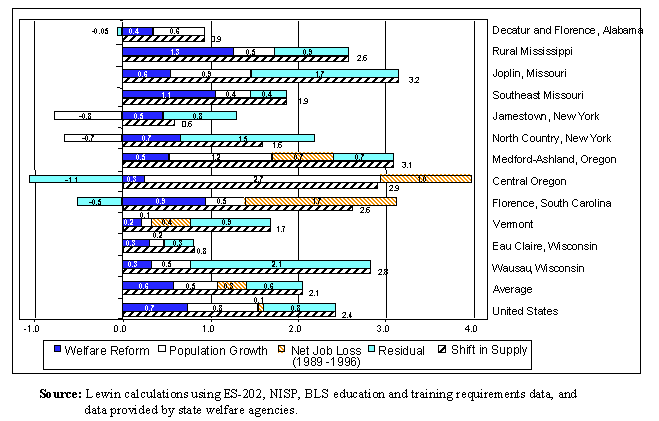
Exhibit ES.7 presents the average contribution of three supply factors welfare reform, population growth, and net job loss from the earlier recession to the change in employment, with the residual accounting for the remaining unknown factors (each is defined below).
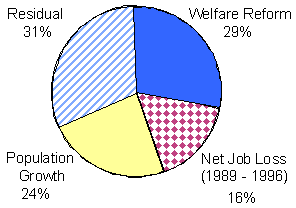
- Welfare reform: the maximum effect of welfare reform, assuming the increase of welfare recipients in the labor force was due to welfare reform. We estimated that on average, welfare reform accounted for, at most, 29 percent of the shift in supply.
- Net job loss: the percent reduction in employment between 1989 and 1996. This estimates the number of workers who were available to work in 1996, but who were not working due to the earlier recession. In some regions, the economy had not recovered to the 1989 levels, so presumably there was an excess supply of workers who were willing to work at the prevailing wage, but who were unemployed because wages did not adjust downward. When the economy began to recover, employers began to demand more labor, and the pool of unemployed workers in the low-skill labor market likely facilitated an increase in employment without an increase in wages. Averaged across all 12 regions, net job loss accounted for 16 percent of the shift in supply on changes in employment between 1996 and 1998.
- Population growth: the percentage increase in population. Population growth accounted for about 24 percent of the shift in supply, although this varied greatly by region.
- Residual: the difference between the total and three identified factors. The expansion of the EITC, as well as measurement error, may account for some share of the residual. Approximately 31 percent of the shift in supply could not be explained by the three other factors.
Exhibit ES.8 presents the contribution by region and the total contribution of the shift in supply on changes in employment. As this exhibit shows, there was significant variation across the regions. For example, we found net job loss in the Oregon regions, Florence, South Carolina, and Vermont, but not in the other regions (the other regions had recovered to the 1989 levels). Population growth occurred in all regions except in the New York regions.
- In the absence of the economic expansion, welfare recipients would have taken jobs from other low-skill workers, but the percent of workers displaced would have been small. Due to the strong economy, no measurable displacement occurred in any of the regions.
Displacement represents the percentage of low-skill workers who became unemployed because other low-skill workers entered the labor market and drove wages down. If no other factors had affected supply and demand for low-skill workers from 1996 to 1998, we estimated that welfare reform would have displaced no more than 1.7 percent of low-skill workers in any one of the regions, and an average of 0.8 percent across all regions slightly below the national value of 1.0 percent. The number of welfare recipients who entered employment because of welfare reform is small as a share of the entire low-skill labor force, accounting for little displacement. After considering the effects of demand and other supply factors, we observe no displacement at all, as wages increased in all regions. While the estimates might overlook displacement that occurs at a level of market detail we are not able to observe (e.g., in sub areas of the region, or in specific occupations), we have to conclude that the low-skill labor market in each of these areas had little difficulty in absorbing welfare recipients who entered the market because of welfare reform.
Projecting the Effect of a Recession
We estimated that, overall, a recession comparable to the recession that occurred in the early 1990s would result in a 5 percent decline in employment in the low-skill labor markets, and a 13 percent decline in wages.(5) This assumes that wages adjust downward to clear the labor market, which is unlikely. As a result, the decline in employment is likely to be greater.
While the model estimates the decline in employment and wages, it does not predict the effect on former welfare recipients versus other low-skill workers. The effect on former welfare recipients might be disproportionately large if many have not yet firmly established themselves in the labor force. On the other hand, welfare recipients might be more willing to continue work than other low-skill workers as the recession exerts downward pressure on wages or have better work supports that help them maintain employment during an economic downturn.
We also assessed whether welfare reform made the low-skill labor market more sensitive to the impact of a recession than under a scenario with no welfare reform. We conclude that welfare reform would have little consequence for the impact of a recession on the low-skill labor market in these areas because the increase in employment induced by welfare reform is very small as a share of employment, and because wages will have already adjusted to that increase.
Summary and Implications for Further Research
Overall, we found that between 1993 and 1996, welfare reform had a minimal impact on job displacement and wage reduction. It could have more adversely affected labor markets after 1996, when PRWORA was enacted, but even during this period, the strong economy helped rural and small metropolitan labor markets absorb the inflow of welfare recipients. Even regions that experienced dramatic declines in caseloads, such as the Wisconsin regions, experienced no adverse effects. In a less robust economy, welfare reform likely would have depressed low-skill wage growth and displaced some low-skill workers who were not welfare recipients. The size of these effects, however, appears to be small relative to the effects of other factors whose fluctuations affect low-skill labor markets such as population growth and the business cycle because welfare recipients who enter the labor market are a fairly small share of the low-skill labor force in each area.
Several limitations of this study deserve mention:
- The magnitude of the estimated effects of welfare reform and the economy are dependent on the estimates of the elasticity of labor demand and labor supply. Only national-level estimates are available, and even among these there is a significant range. Differences in elasticities across rural and urban areas may exist. We conducted a sensitivity analysis (incrementing and decrementing the elasticities by 0.1) and found that our basic findings are not affected much by reasonable changes in the elasticities as a result of the small size of the increase in employment due to welfare reform relative to the low-skill labor market.
- The estimates of welfare recipients who entered the labor market relied on estimates obtained from a national leaver study. If differences in the percent of leavers who entered the labor market differ between rural and urban areas, then the maximum effect of welfare reform on employment and wages could differ from the ones presented.
- We cannot account for the effect of the EITC in our estimates. We believe the expansion primarily affected the 1993 to 1996 period, and may have affected some of the unexplained shift in the supply curve during this period. A recent study separated the effect of EITC expansions from the effect of welfare policies and local labor market conditions, and found that EITC expansions have a large positive effect on employment of adults from welfare families.(6)
- We allocated industry payroll to low-skill, medium-skill, and high-skill occupations in each of the three years based on the payroll distribution of occupations within industries in 1998; distributions for earlier years did not exist. The extent to which the percent distribution differed between 1993 and 1998 affects our low-skill wage estimates, but not the employment estimates.
- We found that welfare reform did not significantly affect the market for low-skill labor because the market is large relative to the number of welfare recipients entering it. Because we defined the low-skill market narrowly assuming that welfare recipients sought jobs that required little education or on-the-job training we believe we might be over-estimating, and not under-estimating, the effect of welfare reform on labor markets.
Future studies could augment this study by collecting additional information and using other data sources not available to us at the time of this study. In addition, more will be learned about the effect of time limits on reducing caseloads and the effect of welfare reform during periods of slow economic growth. Future studies could address the following:
- In the next few years, as more welfare recipients reach time limits and as the economy slows and, perhaps, enters a recession, will welfare recipients begin to displace low-skill workers and affect wage levels? Will they be more or less vulnerable to job loss than other low-skill workers? To conduct future analysis, researchers will be able to rely on the Occupational Employment Statistics survey, which began collecting wage information starting in 1996. This survey is also a better source for employment information by occupation. Finally, some of the confounding factors we encountered such as the EITC and the effects of the earlier recession will not have as large an effect on the estimates going forward.
- Are welfare leavers in rural areas more or less likely to enter the labor force than their counterparts in urban areas? To date, leaver studies have focused primarily on urban areas and offer little information on the labor force participation of welfare leavers living in more rural areas. An analysis of national data sets, such as the National Survey of Americas Families, focusing on welfare recipients living in rural areas could supplement this study. In addition, some leaver studies include an adequate sample size of individuals residing in rural areas; future research could analyze these subsamples in more detail.
- Are welfare offices in rural areas able to offer the job search and job training assistance available in urban areas? What percent of the welfare population in rural areas are exempt from time limits and work participation requirements because of the lack of services? Field research or phone surveys targeting these study regions could provide useful information on the issues facing welfare offices in rural labor markets, and provide context for some of the findings from this study.
- What types of jobs are welfare recipients taking? Did we narrow the field to the correct set of occupations? Are these jobs likely to evaporate during a downturn? Field research conducted in some of these study regions would supplement the analysis from this study.
Endnotes
(1) From P. Loprest and S. Brauner (1999). Where Are They Now? What States Studies of People Who Left Welfare Tell Us. The Urban Institute. Washington, DC: A survey of state leaver studies found that employment rates ranged from 55 to 75 percent for continuous leavers who were surveyed at a point in time after leaving.
(2) The number of welfare recipients in the labor force is a rough estimate based on caseload declines, estimates of the percent of leavers in the labor force, and estimates of the percent of welfare recipients combining work and welfare from caseload reports.
(3) Our estimates are based on the changes in caseloads between two points in time, and thus are affected by the exit and entrance of welfare recipients. Therefore, welfare diversion is accounted for in our estimate of caseload declines, although it is not possible to separate out its effect.
(4) North Country experienced a reduction in low-skill employment, which coincided with a decline in the population. Some of the welfare recipients who left the rolls may also have left the region during this period.
(5) The unemployment rate increased from 5.3 percent in 1989 to its peak of 7.5 percent in 1992. Council of Economic Advisors (2001). Economic Report of the President. Washington, DC.
(6) Hotz, J. H., Mullin, C. H., and Scholz, J. K. (2000). The Earned Income Tax Credit and Labor Market Participation of Families on Welfare. Paper for the Joint Center for Poverty Research Conference on Means-Tested Transfers, December 7-8, 2000.
