
U.S. Department of Health and Human Services
A Demographic and Attitudinal Profile of Non-Buyers of the Federal Long-Term Care Insurance Program
LifePlans, Inc.
August 2004
This policy brief was prepared under contract between the U.S. Department of Health and Human Services (HHS), Office of Disability, Aging and Long-Term Care Policy (DALTCP) and LifePlans, Inc. For additional information about the study, you may visit the DALTCP home page at http://aspe.hhs.gov/_/office_specific/daltcp.cfm or contact the ASPE Project Officer, Hunter McKay, at HHS/ASPE/DALTCP, Room 424E, H.H. Humphrey Building, 200 Independence Avenue, SW, Washington, DC 20201. His e-mail address is: Hunter.McKay@hhs.gov.
I. BACKGROUND
One of the more ambitious proposals for encouraging growth in the private insurance market was the passage of the Long Term Care Security Act (Public Law 106-265). This act was passed in the summer of 2000 and was signed into law on September 19th of that year. It authorized the U.S. Office of Personnel Management (OPM) to contract for a long-term care (LTC) insurance program for federal employees. Medically underwritten coverage was made available to active federal employees and annuitants (civilian retirees), as well as active and retired members of the uniformed services. It was also made available to 'other qualified relatives,' who would include current spouses of employees and annuitants, including surviving spouses of members and retired members of the uniformed services who are receiving a survivor annuity, adult children of living employees and annuitants, and parents, parents-in-law, and stepparents of living active employees. Because this coverage is medically underwritten, certain medical conditions prevented some people from being approved for coverage. OPM expected that, like the health and life insurance programs it administers, the Federal Long-Term Care Insurance Program (FLTCIP) would become the largest employer-sponsored LTC insurance program in the nation.
Naturally it was expected that implementation of the program would spur additional interest and growth in the market. The program began in earnest in July of 2002, which constituted the beginning of the open enrollment period. The carriers underwriting the program -- John Hancock and MetLife -- formed a joint venture called Long Term Care Partners, LLC, which is devoted exclusively to administering the program.
Long Term Care Partners conducted one of the largest LTC educational campaigns ever. More than one million people requested enrollment kits. As of August 2003, 273,000 applications had been received. About 64% of enrollees were active employees and spouses, 31% annuitants and their spouses, and another 5% surviving spouses, parents/in-laws and adult children. Thus, in relatively short order, the FLTCIP became the largest group programs in the United States. In part this was due to the significant marketing and enrollment activities including more than 2,100 educational meetings, briefings to human resources staff and outreach programs to affinity groups.
The large number of enrollments affords a unique opportunity to better understand the attitudes and perspectives of both working and retired individuals regarding LTC concerns, the importance of planning, and the role that insurance may (or may not) play in meeting the needs of disabled individuals. An examination of such attitudes can assist policymakers as well as insurers to better understand marketplace opportunities and barriers, and devise strategies to encourage growth in the market.
II. PURPOSE
The purpose of this project is to analyze survey data collected by Long Term Care Partners from members of the federal family regarding the LTC insurance offering available to them. The analysis focuses on the attitudes, opinions and motivations of both active employees and retirees who have enrolled in the program ("buyers"), those who have expressed an interest in the program but chosen not to enroll ("non-buyers"), and those who are members of the federal family but have not enrolled or expressed any interest in doing so ("non-responders"). As part of this project, we also compare the results to available data from other studies of non-federal buyers and non-buyers in both the individual and group markets. In this way we are able to determine the extent to which there are significant differences, which could influence both the marketing and future design of LTC insurance. Finally, we examine specific issues within each of he three sample groups.
This is the second in a series of data briefs based on the information collected for a study of buyers, non-buyers, and non-responders to the FLTCIP. The purpose of this data brief is to analyze survey data collected from individuals who chose not to enroll in or purchase the plan -- that is, "non-buyers". The analysis focuses on the attitudes, opinions and motivations of individuals who requested an information kit and application but did not purchase the policy. Where appropriate, we also compare these non-buyers to other individuals who have shown interest, but not purchased private LTC insurance either in the individual or employer group markets. Relevant research questions answered in this brief include but are not limited to the following:
- What are the socio-demographic characteristics of active and retired non-buyers?
- What is the attitudinal profile of active and retired non-buyers with respect to retirement planning, experience with LTC, attitudes about insurance, and knowledge of risk?
- What are the principal factors that may motivate these individuals to participate in the federal LTC insurance program?
- How do federal non-buyers compare to other non-buyers in the group and individual markets?
III. METHOD AND SAMPLE
We used mail surveys to collect information from non-buyers. A "non-buyer" was defined as someone who expressed interest in the FLTCIP by requesting an information kit and application, but had not purchased the plan at the time we drew the sample. Between the months of January 2003 and April 2003, roughly 4,000 surveys were mailed out to non-buyers of the federal program. About 33% of these individuals -- 1,300 respondents -- returned their surveys. We removed about 10% of these returned surveys because they turned out not to meet the "non-buyer" criteria. The final analytic sample was comprised of 1,161 respondents -- 575 actives and 586 retirees. All identifying information was stripped from the data file so that specific information could not be correlated to a specific individual.
IV. FINDINGS
A. Demographic Characteristics
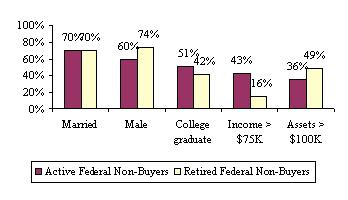
Figure 1 summarizes the demographic characteristics of non-buyers. Findings indicate that the majority of non-buyers are married, male, college educated and have high incomes and assets. Not surprisingly, the actively working (active) non-buyers have significantly higher incomes, but lower assets than the retired non-buyers. The average age of active federal non-buyers is 53 whereas for retired federal non-buyers the average age is 70.
| Figure 1: Demographic Characteristics of Non-Buyers |
 |
| Source: Analysis of Non-Buyer Data from the FLTCIP, 2003. |
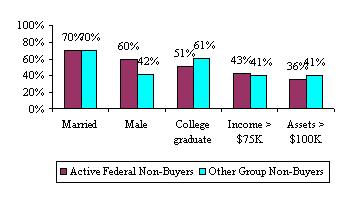
Figure 2 below shows the differences between the active sample of federal non-buyers and a sample of non-buyers offered group policies in other settings. As shown, federal non-buyers tend to have a higher proportion of males and less likely to be college educated. The income, asset, and marital profiles of the two groups are mostly similar. The average age of non-federal non-buyers is slightly younger at 48 years.
| Figure 2: Socio-Demographic Characteristics of Active Federal Non-Buyers and Other Group Non-Buyers |
 |
| Source: Analysis of Non-Buyer Data from the FLTCIP, 2003 and Health Insurance Association of America, 2000. |
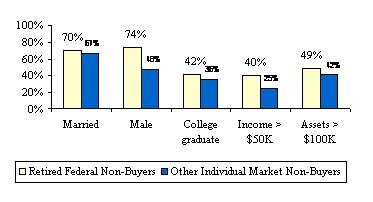
Figure 3 compares demographic characteristics of retired federal non-buyers to non-buyers age 55 and over drawn from the individual market. Retired non-buyers in the federal market are slightly more educated and many more are male. They also have higher income levels and slightly higher assets. In fact, federal retired non-buyers are 1.6 times more likely to have incomes in excess of $50,000 compared to other retirees who have chosen not to purchase policies. The average age for non-buyers in the individual market is similar to that of federal non-buyers at 71.
| Figure 3: Socio-Demographic Characteristics of Retired Federal Non-Buyers and Other Individual Market Non-Buyers |
 |
| Source: Analysis of Non-Buyer Data from the FLTCIP, 2003 and Health Insurance Association of America, 2000. |
B. Attitudes and Opinions about Retirement Planning and Long-Term Care
Interestingly, most non-buyers seem to understand the importance of planning for retirement and for LTC needs. Over three-quarters of active non-buyers indicated that they have done retirement planning and about two-thirds have some idea of how much they need to save in order to live comfortably in retirement. Similarly, 67% of retired non-buyers had done retirement planning and about 70% had at least a general sense of how much they needed to save in order to live comfortably during retirement. Not surprisingly, federal family members who had investigated the FLTCIP, but had not yet applied, were thinking about how they would pay for LTC expenses. Seventy-two percent of active non-buyers had given at least some thought (21% of them a great deal) to paying for LTC expenses. Eighty-two percent of retired non-buyers had also thought about how to pay for LTC expenses (26% of them a great deal of thought). In addition, the majority of both samples (79% of actives and 65% of retired) felt that LTC insurance was an important part of planning for retirement. The overall picture of non-buyers is that they understand the importance of planning for retirement and LTC and they are thinking about how to pay for LTC should the need arise. These attitudes suggest that perhaps there are other mitigating factors surrounding their decision not to purchase the insurance.
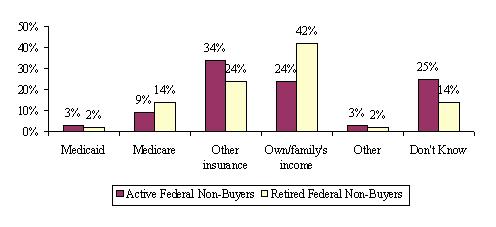
Since the introduction of LTC insurance, agents, financial planners and insurers have been trying to educate people about how LTC services are paid for. Significant effort has been put forth to educate people in this regard. To help understand how effective this education has been, we asked non-buyers of the FLTCIP how they plan to pay for the cost of LTC, should the need arise. Figure 4 shows that only a small percentage of non-buyers believe that Medicaid will pay for LTC costs. A somewhat high percentage (one-third for actives and one-quarter for retired) believe (erroneously) that they can use other insurance (i.e., their own health insurance or retiree health plan or Medicare supplement insurance) to pay for LTC. Retirees seem to have a better understanding that they would most likely have to use their own income to pay for any needed LTC, whereas a quarter of the active non-buyers said they just did not know how they would cover the costs.
| Figure 4: How Non-Buyers Would Pay for the Costs of LTC if Needed |
 |
| Source: Analysis of Non-Buyer Data from the FLTCIP, 2003. |
We also asked specifically whether non-buyers agreed with the statement that public programs (Medicare and Medicaid) would pay the cost of LTC. About three-quarters of both active and retired non-buyers agreed that public programs would not pay for LTC, further supporting that the majority understand the personal responsibility involved in planning for LTC needs. In the past, there has been a commonly held belief that a large barrier to purchase was the misconception about who pays for LTC. These findings would seem to contradict that belief and suggest that there is some other reason that this group of seemingly well informed (in terms of LTC and retirement) non-buyers have not purchased LTC insurance.
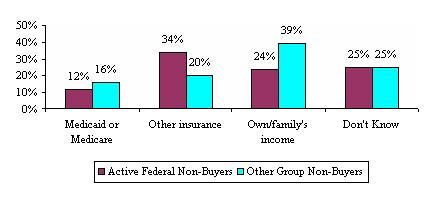
Figure 5 shows active federal non-buyers beliefs about how they would pay for LTC (if needed) compared to non-federal non-buyers in the employer group market. For comparability, we have combined some categories. It appears that knowledge about whether Medicaid or Medicare will pay for LTC expenses seems similar, but federal non-buyers are more likely to believe their own health insurance (or Medicare supplement insurance) will pay for care than are those non-buyers in other group settings. Employees in other settings are more likely to believe they would have to rely on their own or their family's income if they needed care. There is a slight age difference between the two samples and this may account for some of the differences.
| Figure 5: How Federal Active Non-Buyers and Other Group Market Non-Buyers Would Pay for the Costs of LTC if Needed |
 |
| Source: Analysis of Non-Buyer Data from the FLTCIP, 2003 and Health Insurance Association of America, 2000. |
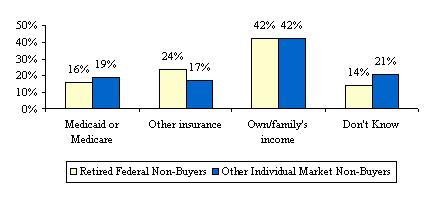
Figure 6 shows comparisons of retired federal non-buyers with non-federal non-buyers age 55 and over in the individual market. These two groups are very similar in terms of their beliefs about whether public programs will pay for care. Again, federal non-buyers are more likely to believe that their own health insurance will pay for LTC.
| Figure 6: How Retired Federal Non-Buyers and Other Individual Market Non-Buyers Would Pay for the Costs of LTC if Needed |
 |
| Source: Analysis of Non-Buyer Data from the FLTCIP, 2003 and Health Insurance Association of America, 2000. |
C. Experience with Long Term Care
It is said that experience is the best teacher. Many of those who advocate planning for LTC have had some experience either caring for and/or arranging for care of a loved one, or paying for care. Non-buyers were asked if they had any of several experiences with LTC and about half of actives and retirees indicated that they had a parent who needed care. The same number also indicated that they knew someone who had to use most of their savings and/or assets to pay for LTC. We also asked if the respondent had cared for an elderly relative or friend and one-quarter of active federal employee non-buyers said they had while 38% of retired non-buyers said the same.
D. Experience with Long Term Care Insurance
One very interesting finding from the survey of non-buyers is that 11% of actives and 20% of retirees stated that they had LTC insurance (with another carrier).1 When the Federal Government first proposed the idea of offering LTC insurance to its employees and retirees, experts predicted that this would increase sales to other carriers simply because of the massive education and marketing campaign about the importance of planning for LTC. We asked those non-buyers who had LTC insurance with another carrier (11% of actives and 20% or retireds) if they bought it before or after they heard about the federal program. Almost half (47%) of active non-buyers indicated they had purchased their policies after hearing about the FLTCIP. Only 13% of retired non-buyers said the same, which is not surprising given their age. We would expect that most of the retired sample that had LTC insurance (not through the FLTCIP) would have purchased it when they were somewhat younger, that is, before the federal offering.
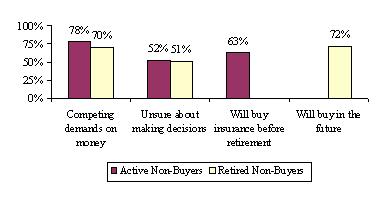
We presented those non-buyers who did not have insurance through another carrier with a series of statements about LTC insurance and asked them if they agreed or disagreed with them. Figure 7 shows the percentages of those who agreed or strongly agreed with each statement.2 For the most part, non-buyers appear to be interested in buying LTC insurance, but agree that there are obstacles. The majority of both active and retired non-buyers agreed with the statement that " they would purchase LTC insurance now, but that there were too many competing demands on their money (78% and 70% respectively) and/or they were unsure they could make good decisions about it (52% and 51% respectively)." It is clear from their responses that a majority of these non-buyers may be classified as "potential buyers" who have just not yet bought a policy. Two-thirds of actives indicated that they would buy LTC insurance before they retire and 72% of retired non-buyers agreed that they would consider purchasing the insurance in the future. While stated intentions do not automatically translate to certain purchase, these non-buyers do represent potential future buyers and therefore, successful future marketing campaigns will likely take account of their attitudes and opinions.
| Figure 7: Opinions About Buying LTC Insurance |
 |
| Source: Analysis of Non-Buyer Data from the FLTCIP, 2003. |
E. Decision Making and Application Process for the FLTCIP
We were interested to know how serious the non-buyers were about purchasing the FLTCIP. After all, these individuals did request an information kit and application, thus indicating real interest and intention about the program. Table 1 shows that the majority of non-buyers who requested information were somewhat or very serious about buying the FLTCIP -- three-quarters of the active and almost two-thirds of the retired samples. Seventy percent of active non-buyers said they thought it was likely or very likely that they were going to buy the FLTCIP when they initially requested the application; fewer retired non-buyers said the same (54%). It is clear that there was a significant amount of interest on the part of the non-buyers. So, what stopped them from buying the FLTCIP?
| TABLE 1: Decision Making Process of Active and Retired Non-Buyers | ||
| Decision Making Process | Active Non-Buyers | Retired Non-Buyers |
| How seriously was buying the FLTCIP considered | ||
| Very seriously | 34% | 25% |
| Somewhat seriously | 41 | 38 |
| Not very seriously | 16 | 20 |
| Not seriously at all | 5 | 6 |
| Did not consider | 4 | 11 |
| How likely did you think it was that you would buy the FLTCIP when you requested the application | ||
| Very likely | 18 | 11 |
| Likely | 52 | 43 |
| Not very likely | 28 | 40 |
| Not at all likely | 2 | 6 |
| SOURCE: Analysis of Non-Buyer Data from the FLTCIP, 2003. | ||
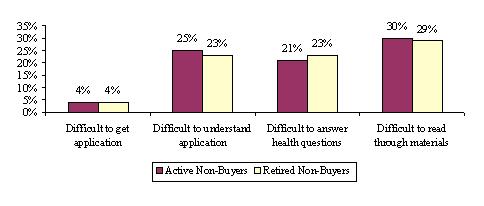
One possible place to look is the application process. We asked the non-buyers a series of questions about the application process to see if they found various aspects of it easy or difficult (see Figure 8). It appears that both active and retired non-buyers found the process easy. The majority of both samples were able to get an application, read and understand it, and answer the health questions. The majority was also able to get their questions about the federal program answered easily, although between 25%-30% said they found it difficult or very difficult to get answers to their questions. These responses do not seem to indicate that the application process contributed materially to the fact that the non-buyers did not buy the FLTCIP.
| Figure 8: Application Process for Non-Buyers |
 |
| Source: Analysis of Non-Buyer Data from the FLTCIP, 2003. |
F. Reasons for Not Buying the FLTCIP and Factors that would Increase Interest
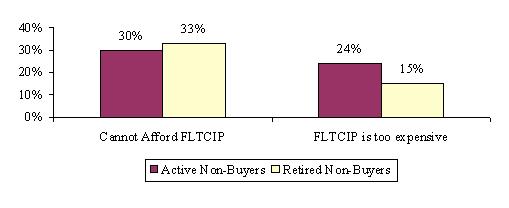
To better understand why these potential buyers did not actually purchase the FLTCIP, we presented them with a series of statements. They were directed to indicate whether or not a particular statement was a reason they did not purchase the FLTCIP. Respondents were then asked to indicate which one of the reasons presented was the most important to their decision not to purchase the FLTCIP. Not surprisingly, 53% of active non-buyers and 49% of retired non-buyers indicated that they could not afford to buy the FLTCIP. Further, about two-thirds of both active and retired federal employees thought that the FLTCIP was too expensive. When asked what the single most important reason was that they did not buy the FLTCIP, these two reasons were first and second on the list for both active and retired non-buyers (see Figure 9). This finding is similar to that in other non-buyer research.
| Figure 9: Most Important Reason for not Purchasing the FLTCIP |
 |
| Source: Analysis of Non-Buyer Data from the FLTCIP, 2003. |
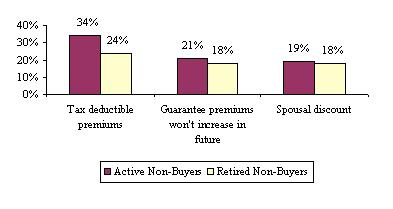
We also asked non-buyers what would make them more interested in buying the FLTCIP. One in three active non-buyers and one in four retired indicated that tax-deductible premiums would be the single most important thing that would make them more interested in buying the FLCTIP. This was followed by a guarantee that premiums would not increase and also the availability of a premium discount for spouses enrolling in the program (see Figure 10).
| Figure 10: Top Factors that Would make Non-Buyers More Interested in Buying the FLTCIP |
 |
| Source: Analysis of Non-Buyer Data from the FLTCIP, 2003. |
V. CONCLUSIONS
As these findings indicate, the non-buyers of the FLTCIP are well educated about the need for retirement and LTC planning. The majority seems to understand that they will have to bear at least some, if not most, of the financial responsibility of any LTC they might need. Further, this group or at least a sizeable proportion was serious about buying the program. A large number of them indicated that they have not ruled out purchasing the program in the future. The largest barrier to purchase for these non-buyers (and other non-buyers in the general population) was affordability. Further sensitivity analysis of those non-buyers who report higher income and assets may be warranted to better understand the affordability issue. Therefore, perhaps continuing to market to this group of active and retired federal employees and making sure that they remain aware of the FLTCIP program could result in more members of the federal family being insured.
REFERENCES
Health Insurance Association of America (2000), "Who Buys Long Term Care Insurance in 2000? A Decade of Study of Buyers and Nonbuyers." Washington, D.C.
NOTES
-
Those non-buyers who stated they had LTC insurance were removed from the non-buyer category when doing analysis of attitudes and opinions toward retirement planning, LTC and LTC insurance.
-
Some statements were not presented to one or the other sample, as they were sample-specific.
APPENDIX
Notes for Tables
Unless otherwise indicated, the analysis of the data is based on the responses of 6,870 active and 487 retired non-responders.
All significance tests are based on 5% level or better. Notations for significance are as follows: If one category out of three contains the symbol (*), then the category starred is statistically different from each of the other two categories, but the non-starred categories are not different from each other. If two categories out of the three contain the symbol (*), then those two categories are statistically different from each other, but each of those categories is not statistically different from the third one. If all three categories contain the symbol (*), then all three are statistically different from each other.
Unless otherwise specified, only the response category that has a notation of significance was tested against all other categories. In some cases, it was determined that a combination of categories would be tested. These are indicated in the footnotes. It also may be the case that if categories were or were not combined, it could change the results of the test of significance.
Unless otherwise indicated, the first response category (i.e., strongly agree, very important, very likely, etc.) or the yes response was tested. Therefore, if there are no notations for significance, the test was not significant at the 5% level.
| TABLE A-1: Socio-Demographic Characteristics of Active and Retired Non-Buyers | ||
| Socio-Demographic Characteristics | Active Non-Buyers | Retired Non-Buyers |
| Average age | 53 | 71 |
| Less than 50 | 34% | 2% |
| 50 to 54 | 24 | 3 |
| 55 to 59 | 19 | 7 |
| 60 to 64 | 10 | 12 |
| 65 and over | 13 | 76 |
| Gender | ||
| Male | 60 | 74 |
| Female | 40 | 26 |
| Marital status | ||
| Never Married | 10 | 4 |
| Married | 70 | 70 |
| Divorced/separated | 16 | 8 |
| Widowed | 3 | 18 |
| Domestic Partner | 1 | 0 |
| Presence of children living within 25 miles | ||
| Yes | 59 | 55 |
| No | 41 | 45 |
| Education level | ||
| Less than high school graduate | 1 | 3 |
| High school graduate | 13 | 17 |
| Technical/trade/business school | 5 | 8 |
| Some college | 30 | 30 |
| College graduate | 28 | 24 |
| Graduate degree | 23 | 18 |
| Average income1 | $73,912 | $50,901 |
| Less than $15,000 | 1 | 4 |
| $15,000 to $24,999 | 1 | 13 |
| $25,000 to $34,999 | 5 | 12 |
| $35,000 to $39,999 | 6 | 15 |
| $40,000 to $49,999 | 14 | 16 |
| $50,000 to $59,999 | 13 | 12 |
| $60,000 to $69,999 | 10 | 8 |
| $70,000 to $74,999 | 7 | 4 |
| $75,000 to $99,999 | 20 | 10 |
| $100,000 to $124,999 | 13 | 3 |
| $125,000 or more | 10 | 3 |
| Average liquid assets1 | $161,433 | $169,730 |
| Less than $10,000 | 17 | 11 |
| $10,000 to $19,999 | 8 | 6 |
| $20,000 to $29,999 | 7 | 7 |
| $30,000 to $49,999 | 12 | 12 |
| $50,000 to $74,999 | 12 | 9 |
| $75,000 to $99,999 | 8 | 6 |
| $100,000 to $124,999 | 7 | 6 |
| $125,000 to $149,999 | 5 | 5 |
| $150,000 to $199,999 | 4 | 8 |
| $200,000 to $249,999 | 4 | 6 |
| $250,000 and above | 16 | 24 |
| Home ownership | ||
| Yes | 86 | 90 |
| No | 14 | 10 |
| ||
| TABLE A-2: Attitudes and Opinions About Retirement Planning and Long-Term Care Among Active and Retired Non-Buyers | ||
| Attitudes and Opinions | Active Non-Buyers | Retired Non-Buyers |
| Done retirement planing | ||
| Yes | 77% | 67% |
| No | 23 | 33 |
| Determnied how much to save to live comforably in retirement | ||
| Yes, a definite sense | 16 | 17 |
| Yes, a general sense | 49 | 54 |
| No | 33 | 29 |
| Do not plan to retire | 2 | |
| Confident that there is enough money to live comfortably in retirement | ||
| Very confident | 13 | 20 |
| Somewhat confident | 54 | 55 |
| Not very confident | 24 | 15 |
| Not at all confident | 7 | 10 |
| Do not plan to retire | 2 | |
| Standard of living during retirement: | ||
| Better than during working years | 8 | 17 |
| Same as working years | 60 | 60 |
| Worse than during working | 30 | 23 |
| Do not plan to retire | 2 | |
| Thought given to paying for LTC expenses | ||
| A great deal | 21 | 26 |
| Some | 51 | 56 |
| Not much thought | 23 | 15 |
| No thought at all | 5 | 3 |
| How important is LTC insurance to retirement planning | ||
| Very important | 25 | 20 |
| Somewhat important | 54 | 45 |
| Not very important | 15 | 22 |
| Not at all important | 1 | 5 |
| Have not started planning | 5 | 8 |
| I worry how to pay for LTC1 | ||
| Strongly agree | 18 | 21 |
| Agree | 45 | 47 |
| Disagree | 31 | 26 |
| Strongly disagree | 6 | 6 |
| It is important to plan now for the possibility of needing LTC services in the future | ||
| Strongly agree | 24 | 25 |
| Agree | 58 | 60 |
| Disagree | 16 | 13 |
| Strongly disagree | 2 | 2 |
| LTC insurance programs sold today will cover the cost of LTC services needed in the future | ||
| Strongly agree | 3 | 3 |
| Agree | 38 | 33 |
| Disagree | 49 | 47 |
| Strongly disagree | 10 | 17 |
| How would LTC costs be paid1 | ||
| Medicaid | 3 | 2 |
| Medicare | 9 | 14 |
| Medigap Supplement Policy | 1 | 2 |
| Own health insurance or retiree health care plan | 33 | 22 |
| Own income | 23 | 42 |
| Children will help pay | 1 | 0 |
| Other | 3 | 2 |
| LTC insurance | 2 | 2 |
| Don't know2 | 25 | 14 |
| ||
| TABLE A-3: Experience with LTC Among Active and Retired Buyers | ||
| Experiences with LTC | Active Non-Buyers | Retired Non-Buyers |
| Respondent needed LTC | ||
| Yes | 1% | 2% |
| No | 99 | 98 |
| Spouse needed LTC | ||
| Yes | 1 | 6 |
| No | 99 | 94 |
| Parent needed LTC | ||
| Yes | 54 | 49 |
| No | 46 | 51 |
| Close friend needed LTC | ||
| Yes | 7 | 14 |
| No | 93 | 86 |
| The respondent has been a caregiver | ||
| Yes | 25 | 38 |
| No | 75 | 62 |
| The respondent knew someone who has used most of his/her assets to pay for LTC | ||
| Yes | 48 | 50 |
| No | 52 | 50 |
| The respondent has experienced financial hardship as a result of caring for an elderly relative | ||
| Yes | 9 | 9 |
| No | 91 | 91 |
| The respondent knew someone who has experienced financial hardship as a result of caring for an elderly relative | ||
| Yes | 41 | 37 |
| No | 59 | 63 |
| TABLE A-4: Self-Assessed Risk of Needing LTC Among Active and Retired Buyers and Views About LTC Coverage of Costs | ||
| Experiences with LTC | Active Non-Buyers | Retired Non-Buyers |
| How likely is it that: | ||
| a) the respondent thinks he/she will need help with everyday activities like bathing and dressing | ||
| Very likely | 10% | 13% |
| Likely | 14 | 18 |
| Somewhat likely | 35 | 38 |
| Not very likely | 30 | 24 |
| Not at all likely | 11 | 7 |
| b) the respondent thinks he/she will need home care services for more than three months | ||
| Very likely | 10 | 12 |
| Likely | 14 | 18 |
| Somewhat likely | 39 | 39 |
| Not very likely | 28 | 23 |
| Not at all likely | 9 | 8 |
| c) the respondent thinks he/she will need nursing home care for more than three months | ||
| Very likely | 10 | 11 |
| Likely | 13 | 14 |
| Somewhat likely | 34 | 37 |
| Not very likely | 31 | 27 |
| Not at all likely | 12 | 11 |
| d) the respondent thinks he/she will need care provided in an assisted living facility for more than three months | ||
| Very likely | 10 | 11 |
| Likely | 16 | 15 |
| Somewhat likely | 37 | 39 |
| Not very likely | 27 | 25 |
| Not at all likely | 10 | 10 |
| TABLE A-5: Beliefs About LTC Among Active Retired Non-Buyers | ||
| Experiences with LTC | Active Non-Buyers | Retired Non-Buyers |
| It is important to avoid using own income and savings to pay for LTC | ||
| Strongly agree | 33% | 30% |
| Agree | 44 | 45 |
| Disagree | 20 | 20 |
| Strongly disagree | 3 | 5 |
| It is important to choose the place where to receive care | ||
| Strongly agree | 42 | 43 |
| Agree | 48 | 50 |
| Disagree | 9 | 6 |
| Strongly disagree | 1 | 1 |
| There are public programs that will pay the cost of LTC | ||
| Strongly agree | 3 | 4 |
| Agree | 24 | 21 |
| Disagree | 59 | 57 |
| Strongly disagree | 14 | 18 |
| TABLE A-6: Opinions About LTC Insurance Among Active and Retired Non-Buyers | ||
| Opinions about LTC Insurance | Active Non-Buyers | Retired Non-Buyers |
| Do you currently have LTC insurance | ||
| Yes | 11% | 20% |
| No | 89 | 80 |
| Did you buy your LTC insurance after you heard about the FLTCIP1 | ||
| Yes | 47 | 13 |
| No | 37 | 60 |
| I did not know about the FLTCIP | 16 | 27 |
| I would buy LTC insurance now but there are competing demand on my money | ||
| Strongly agree | 33 | 25 |
| Agree | 45 | 45 |
| Disagree | 19 | 26 |
| Strongly disagree | 3 | 4 |
| I would buy LTC insurance now but I am unsure that I can make good decisions about it | ||
| Strongly agree | 15 | 11 |
| Agree | 37 | 40 |
| Disagree | 36 | 37 |
| Strongly disagree | 12 | 12 |
| Insurance companies sell adequate coverage for LTC services | ||
| Strongly agree | 4 | 5 |
| Agree | 40 | 38 |
| Disagree | 43 | 43 |
| Strongly disagree | 13 | 14 |
| ||
| TABLE A-7: Decision Making Process of Active and Retired Non-Buyers | ||
| Decision Making Process | Active Non-Buyers | Retired Non-Buyers |
| How seriously was buying the FLTCIP considered | ||
| Very seriously | 34%* | 25% |
| Somewhat seriously | 41 | 38 |
| Not very seriously | 16 | 20 |
| Not seriously at all | 5 | 6 |
| Did not consider | 4 | 11 |
| How likely did you think it was that you would buy the FLTCIP when you requested the application | ||
| Very likely | 18* | 11 |
| Likely | 52 | 43 |
| Not very likely | 28 | 40 |
| Not at all likely | 2 | 6 |
| TABLE A-8: Experience with the Application Process Among Active and Retired Non-Buyers | ||
| Experience with the Application Process | Active Non-Buyers | Retired Non-Buyers |
| How easy/difficult did the application look to complete | ||
| Never looked at the application | 36% | 43% |
| Looked easy to complete | 51 | 45 |
| Looked difficult to complete | 13 | 13 |
| Was the following easy/difficult for you:1 | ||
| a) getting an application | ||
| Did not get an application | 21 | 29 |
| Did get an application | 79 | 71 |
| Easy to get an application | 96 | 96 |
| Difficult to get an application | 4 | 4 |
| b) understanding the application | ||
| Did not attempt to understand the application | 32 | 34 |
| Did attempt to understand the application | 68 | 66 |
| Easy to understand the application | 75 | 77 |
| Difficult to understand the application | 25 | 23 |
| c) answering health questions | ||
| Did not answer health questions | 41 | 43 |
| Did answer health questions | 59 | 57 |
| Easy to answer health questions | 79 | 77 |
| Difficult to answer health questions | 21 | 23 |
| d) reading the application materials | ||
| Did not read the application materials | 69 | 38 |
| Did read the application materials | 31 | 62 |
| Easy to read the application materials | 70 | 71 |
| Difficult to read the application materials | 30 | 29 |
| Easy/difficult to obtain answers to questions about the federal program | ||
| Very easy | 20 | 16 |
| Easy | 51 | 60 |
| Difficult | 24 | 21 |
| Very difficult | 5 | 3 |
| ||
| TABLE A-9: Exposure to Promotional Activities Among Active and Retired Non-Buyers1 | ||
| Promotional Activities | Active Non-Buyers | Retired Non-Buyers |
| Did you do any of the following: | ||
| a) Talk to colleagues about the federal program | ||
| Did not talk to colleagues | 49% | 79% |
| Did talk to colleagues | 51 | 21 |
| Found it to be helpful | 56 | 66 |
| Did not find it to be helpful | 44 | 34 |
| b) Talk to human resource representative | ||
| Did not talk to human resource representative | 81 | 96 |
| Did talk to human resource representative | 19 | 4 |
| Found it to be helpful | 70 | 53 |
| Did not find it to be helpful | 30 | 47 |
| c) Read "Get Smart About Your Future" | ||
| Did not read "Get Smart About Your Future" | 33 | 40 |
| Did not know about "Get Smart About Your Future" | 11 | 12 |
| Did read "Get Smart About Your Future" | 56 | 48 |
| Found it t be helpful | 87 | 86 |
| Did not find it to be helpful | 13 | 14 |
| d) Read advertisements | ||
| Did not read advertisements | 38 | 45 |
| Did not know about advertisements | 11 | 11 |
| Did read advertisements | 51 | 44 |
| Found them to be helpful | 75 | 79 |
| Did not find them to be helpful | 25 | 21 |
| e) Visit websites describing the federal program | ||
| Did not visit websites describing the federal program | 51 | 77 |
| Did not know about the websites describing the federal program | 10 | 11 |
| Did visit websites describing the federal program | 39 | 12 |
| Found them to be helpful | 83 | 90 |
| Did not find them to be helpful | 17 | 10 |
| f) Read newspaper article | ||
| Did not read newspaper articles | 53 | 55 |
| Did not know about the newspaper articles | 14 | 9 |
| Did read newspaper articles | 33 | 36 |
| Found them to be helpful | 70 | 72 |
| Did not find them to be helpful | 30 | 28 |
| g) Read general brochures | ||
| Did not read general brochures | 18 | 26 |
| Did not know about the general brochures | 5 | 6 |
| Did read general brochures | 77 | 68 |
| Found them to be helpful | 82 | 85 |
| Did not find them to be helpful | 18 | 15 |
| h) Call toll-free number | ||
| Did not call a toll-free number | 75 | 79 |
| Did not know about the toll-free number | 10 | 7 |
| Did call a toll-free number | 15 | 14 |
| Found it to be helpful | 71 | 77 |
| Did not find it to be helpful | 29 | 23 |
| ||
| TABLE A-10: Reasons for Not Buying the Federal Program: Active and Retired Non-Buyers | ||
| Reasons for Not Buying | Active Non-Buyers | Retired Non-Buyers |
| Were the following reasons not to buy the FLTCIP: | ||
| a) Do not think LTC services will ever be needed | ||
| Yes, a reason | 8% | 11% |
| No, not a reason | 92 | 89 |
| b) Medicare/Medicaid will pay for LTC services | ||
| Yes, a reason | 16 | 14 |
| No, not a reason | 84 | 86 |
| c) Family/relatives will take care of individual | ||
| Yes, a reason | 7* | 11 |
| No, not a reason | 93 | 89 |
| d) FLTCIP is too expensive | ||
| Yes, a reason | 66 | 62 |
| No, not a reason | 34 | 38 |
| e) Do not mind using own income to pay for LTC | ||
| Yes, a reason | 15* | 25 |
| No, not a reason | 85 | 75 |
| f) Have other insurance like FEHB | ||
| Yes, a reason | 13* | 19 |
| No, not a reason | 87 | 82 |
| g) Do not believe insurance companies will pay benefits | ||
| Yes, a reason | 18* | 13 |
| No, not a reason | 82 | 87 |
| h) Will buy the FLTCIP later | ||
| Yes, a reason | 52* | 22 |
| No, not a reason | 48 | 78 |
| i) Cannot afford to buy the FLTCIP | ||
| Yes, a reason | 53 | 49 |
| No, not a reason | 47 | 51 |
| j) Premium amount enough to cover LTC needs | ||
| Yes, a reason | 21 | 24 |
| No, not a reason | 79 | 76 |
| k) Information about the FLTCIP too confusing | ||
| Yes, a reason | 22 | 19 |
| No, not a reason | 78 | 81 |
| l) Did not want to be locked into the FLTCIP | ||
| Yes, a reason | 23* | 16 |
| No, not a reason | 77 | 84 |
| m) Have LTC insurance with another company | ||
| Yes | 17* | 22 |
| No | 83 | 78 |
| n) Not happy with the features of the FLTCIP | ||
| Yes | 17 | 16 |
| No | 83 | 84 |
| TABLE A-11: Three Most Important Reasons for Not Buying the FLTCIP Among Active and Retired Non-Buyers | ||
| Reasons for Not Buying | Active Non-Buyers | Retired Non-Buyers |
| Three most important reasons not to buy the FLTCIP | ||
| Cannot afford the FLTCIP | 30% | 33% |
| FLTCIP is too expensive | 24 | 15 |
| Will buy the FLTCIP later | 13 | 15 |
| TABLE A-12: Factors that Would Make Non-Buyers More Interested in Buying the Federal Program | ||
| Factors | Active Non-Buyers | Retired Non-Buyers |
| More interested in buying the FLTCIP if: | ||
| a) There were more choices regarding the amount of home care coverage | ||
| Agree | 58% | 59% |
| Disagree | 42 | 41 |
| b) There was a guarantee that premiums will not increase in the future | ||
| Agree | 83* | 76 |
| Disagree | 17 | 24 |
| c) There was a premium discount for couples who purchase the program | ||
| Agree | 66 | 62 |
| Disagree | 34 | 37 |
| d) Premiums were tax deductible | ||
| Agree | 87* | 77 |
| Disagree | 13 | 23 |
| Three most important factors that would make a non-buyer more interested in buying | ||
| Tax deductible premiums | 34 | 24 |
| A guarantee that premiums will not increase in the future | 21 | 18 |
| A premium discount for couples who purchase the program | 19 | 18 |
A total of nine Policy Briefs are available from the Office of Disability, Aging and Long-Term Care on this subject:
- A Comparison of Demographic and Attitudinal Characteristics Among Active and Retired Buyers, Non-Buyers and Non-Responders to the Federal Long-Term Care Insurance Program [http://aspe.hhs.gov/daltcp/reports/charcom.htm] Posted June 2005
- A Comparative Analysis of the Socio-Demographic and Attitudinal Characteristics of Active Buyers and Non-Buyers of Long-Term Care Insurance in the Federal, Private and Public Sectors [http://aspe.hhs.gov/daltcp/reports/LTCIchar.htm] Posted February 2006
- A Demographic and Attitudinal Profile of Buyers of the Federal Long-Term Care Insurance Program [http://aspe.hhs.gov/daltcp/reports/buyprof.htm] Posted June 2005
- A Demographic and Attitudinal Profile of Non-Buyers of the Federal Long-Term Care Insurance Program [http://aspe.hhs.gov/daltcp/reports/nonbuyprof.htm] Posted September 2005
- A Demographic and Attitudinal Profile of Non-Responders of the Federal Long-Term Care Insurance Program [http://aspe.hhs.gov/daltcp/reports/nonresprof.htm] Posted September 2005
- Does Geographic Location Make a Difference? A Comparative Analysis of the Socio-Demographic and Attitudinal Characteristics of Active Buyers and Non-Buyers of the Federal Long-Term Care Insurance Program [http://aspe.hhs.gov/daltcp/reports/FLTCIloc.htm] Posted February 2006
- Marketing Activities: A Comparative Analysis of Engagement and Participation Among Buyers, Non-Buyers and Non-Responders of the Federal Long-Term Care Insurance Program [http://aspe.hhs.gov/daltcp/reports/markact.htm] Posted July 2005
- Multivariate Analysis of Buyers and Non-Buyers of the Federal Long-Term Care Insurance Program [http://aspe.hhs.gov/daltcp/reports/FLTCIanal.htm] Posted September 2005
- What We Know About Buyers and Non-Buyers of Private Long-Term Care Insurance: A Review of Studies [http://aspe.hhs.gov/daltcp/reports/LTCIlr.htm] Posted September 2005